USD/CAD Technical Analysis: Time Correction Heading Into BoC
DailyFX.com -
Talking Points:
USD/CAD Technical Strategy: Triangulation through February
BoC statement likely to provide positive nudge, but no action anticipated
Previous Article: USD/CAD Technical Analysis: Wedging Between Hard Support And 200-DMA
If you’re looking for trading ideas, check out our Trading Guides
USD/CAD has many traders losing patience after a strong downtrend took the price below the rising Trendline (red) drawn of the closing low in May. On Wednesday, we get the Bank of Canada, but we’ll be without a Monetary Policy Report and subsequent press conference. Therefore, it’s fair to say that there will be a nod toward the positive developments in the commodity market with uncertainty on the horizon surrounding new Trade Policies coming from friends of the south and the possible implications of the USD.
Interested in Joining Our Analysts, Instructors, or Strategists For a Free Webinar? Register Here
The two charts below, an H4 and Daily Chart, show complementary views that favor a continuation of the downside move that began in November. We’ve seen Canadian Dollar strength that is backed by much of the Commodity run and subsequent USD weakness since the Fed hiked in December. However, February has been a sideways affair.
As many of you have read in my prior reports, consolidation (as we get in a Triangle Pattern), tend to favor continuation of the prior trend. In the case of USD/CAD, that would favor a move lower when we do get the subsequent volatility.
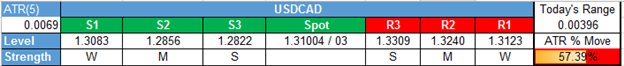
I’m awaiting a price breakdown and close below the support levels of 1.3083/76 to validate the view. However, we do see a lot of support at 1.3000 as the price continues to hold up above 1.3000 or find bids. Regarding resistance, the price has had a difficult time breaking above the twin forms of resistance of the 200-DMA at 1.3148 and the Fibonacci Zone that currently rests at 1.32274/31285.
As to whether I am looking for support or resistance to breaking, I would favor price remaining below this resistance level, while looking for a subsequent move lower. A break above the Daily Ichimoku Cloud near 1.3350 would invalidate the Bearish Momentum Bias.
H4 USD/CAD Triangulation For February Favors Eventual Trend Continuation Lower

What Did The Analysts Learn After Trading Of All 2016? Click Here To Find Out
Should momentum eventually continue its course that it begun in November and keep trading below the cloud, I will favor an eventual move lower to 1.2815/2759, which is comprised of two key pivots in late summer. An eventual move lower is consistent with the typical tenets of Ichimoku Momentum-Based trend following that I adhere to in my trading.
D1 USD/CAD Chart: Trading Between Long-Term 1.3000 Support and 200-DMA at 1.3148
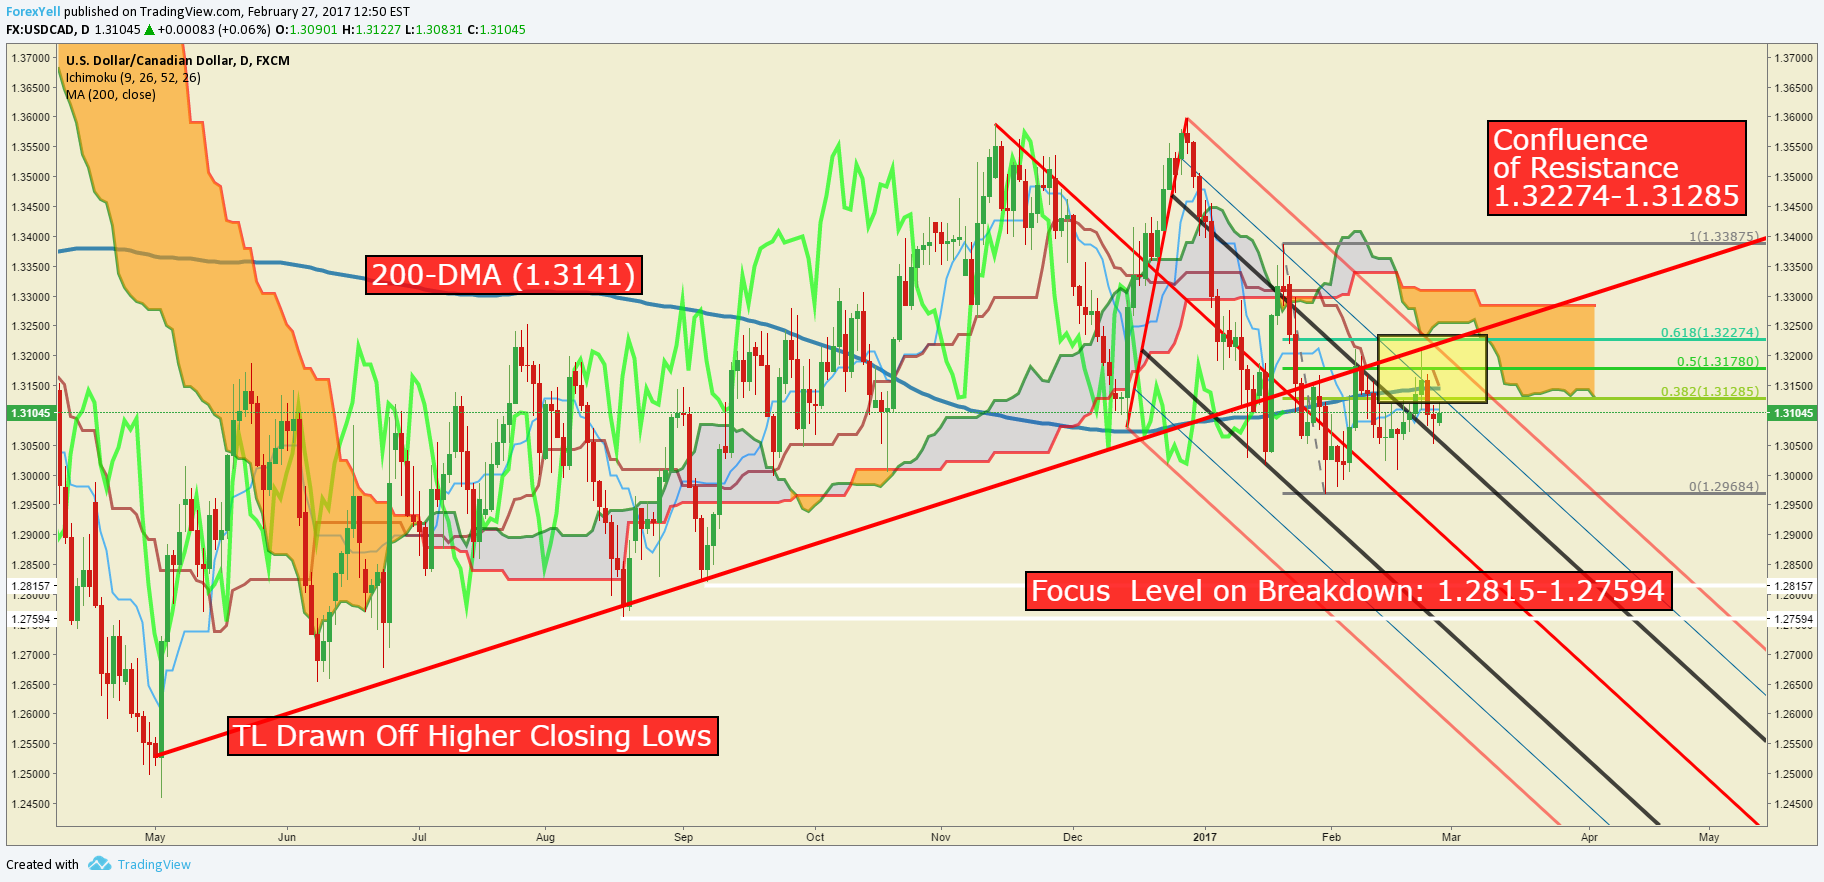
Chart Created by Tyler Yell, CMT
---
Shorter-Term USD/CAD Technical Levels for Monday, February 27, 2017
For those interested in shorter-term levels of focus than the ones above, these levels signal important potential pivot levels over the next 48-hours of trading.
T.Y.
DailyFX provides forex news and technical analysis on the trends that influence the global currency markets.
Learn forex trading with a free practice account and trading charts from IG.

