MAPS: America's $200 billion obesity problem by state and age group
The United States is one of the most overweight nations in the world. The US Senate Committee on Finance estimates that obesity-related health care costs over $200 billion each year.
The rates of obesity in adults across the country are vastly different, however. The website Data Visualisations created a series of maps based on data from non-profit The State of Obesity outlining differences by state.
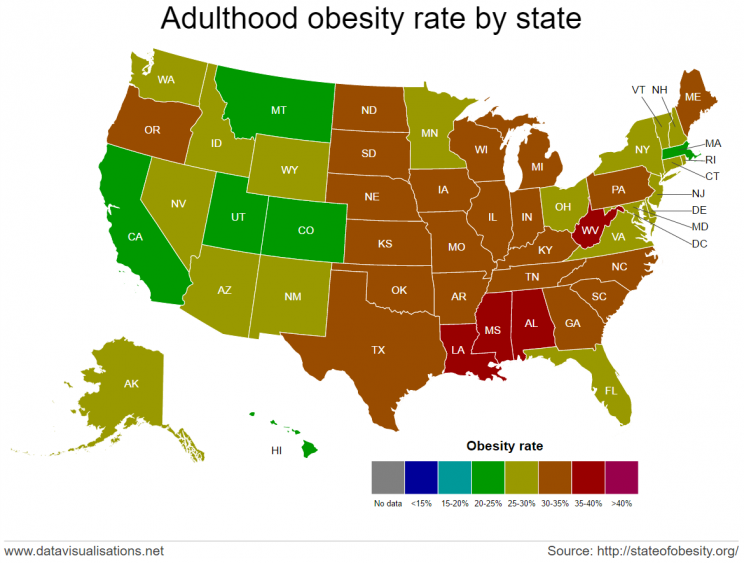
Louisiana has the worst rate at 36.2 percent, while Colorado is the slimmest state at 20.2 percent. There is a definite regional trend to the data — nine of the top 10 states are in the South, while the slimmer states tend to be in the West or Northeast.
Every state in the nation currently has an adult obesity rate over 20 percent, while half have a rate of 30 percent or higher. In 1990, Mississippi had the highest rate at just 15 percent. Colorado was the slimmest state at that time as well, with a rate of just 6.9 percent.
Perhaps unsurprisingly, there is a strong correlation between states with high obesity rates and those that reported lower levels of both physical activity and consumption of fruits and vegetables.
There was some good news in the latest round of data. Four states — Minnesota, Montana, New York and Ohio — saw decreases in obesity rates. That’s the first time the obesity rate has declined in any state in the past decade.
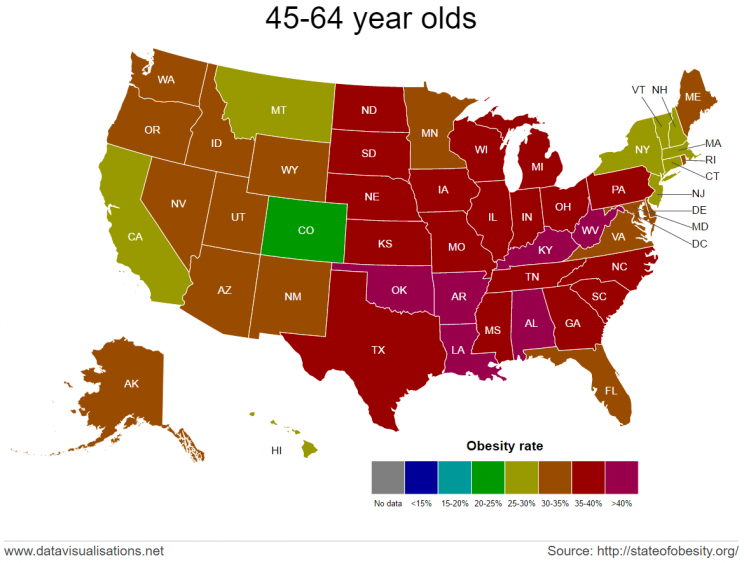
Data Visualisations also broke the data down by age group. As you’d expect, the percentage of obese adults tends to increase with age, with one notable exception — rates peak in the 45-64 range, before declining in adults 65 and over.


Here are the 10 states with the highest obesity rates. You can see the full list here.
1. Louisiana: 36.2%
=2. Alabama: 35.6%
=2. Mississippi: 35.6%
=2. West Virginia: 35.6%
5. Kentucky: 34.6%
6. Arkansas: 34.5%
7. Kansas: 34.2%
8. Oklahoma: 33.9%
9. Tennessee: 33.8%
=10. Missouri: 32.4%
=10. Texas: 32.4%

