Which US cities have the dirtiest air? 2024 State of the Air report ranks them

Almost two out of five Americans breathe unhealthy levels of air pollution during the year. That is 131.2 million of us and 11.7 more people than last year, according to the 2024 State of the Air report by the American Lung Association.
"When we started doing ‘State of the Air’ in 2000, I never imagined that in the 25th edition we would be reporting that more than 100 million people are still breathing unhealthy air," said Paul Billings with the American Lung Association in a statement. "It’s unacceptable."
Even tougher to choke down are the 30 counties across the nation that got failing grades for ozone pollution and small particle pollution, daily levels and annual exposure. Only 98 metro areas had passing grades for ozone pollution. Only 55 metro areas had passing grades for short-term particle pollution.
Western states claim the vast majority of the failing grades. California, in particular, is home to 22 of the 30 counties failing in all categories.
7 FACTS THAT EXPLAIN HOW AIR QUALITY IS MEASURED
"The combination of policy-driven reductions in emissions on the one hand and climate change-fueled increases in pollution, on the other hand, have resulted in an ongoing and marked disparity between air quality in eastern and western states, especially for the daily measure of fine particle pollution," authors wrote in the report. "In this year’s report, only 4 large counties in three states east of the Mississippi River, earned failing grades for daily spikes in fine particle pollution, compared to 108 counties in 16 western states."
In terms of year-round small particle air pollution, western states still top the list with 119 counties. The recent toughening of the EPA definition of "unhealthy air" added Midwestern and Eastern counties to the list, too. East of the Mississippi, 47 counties in 12 states failed.
ARE THERE LONG-TERM HEALTH EFFECTS CAUSED BY EXPOSURE TO POOR AIR QUALITY?
Over a year, a city or county must have an average of 9 micrograms per cubic meter of air or less per day to pass. The previous EPA standard was 12. Almost 90.7 million Americans live in areas with failing grades.
"Cities predominantly affected by western drought and wildfires, notably eight in California, and two each in Nevada, Oregon, and Washington, still made up the highest share," stated the report. "However, cities less affected by wildfire smoke in this year’s report, but still grappling with pollution from local industrial and mobile sources, continued to show up on this list."
Sacramento in California, Reno in Nevada and Eugene, Yakima and Spokane in Washington all had the worst levels ever in the history of the report.

For the daily particle pollution spikes, the association calculated the number of days each city exceeded 35 micrograms per cubic meter, then weighted each day by the severity of the pollution.
To pass, a city could only have 1% of days that exceeded the limit, which would be 21 days over three years. Across the nation, 112 counties in nine states failed, accounting for 65 million people.
WHERE DO OUR TOP AIR POLLUTANTS COME FROM?
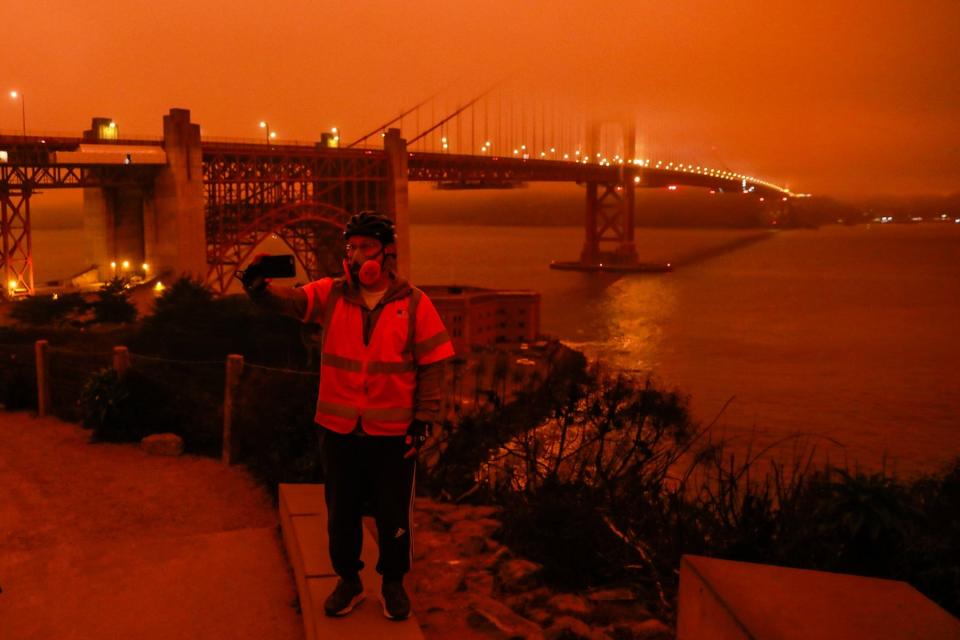
Wildfires were the greatest contributor to small particle pollution. The association counted 79 days in maroon air quality, which means a risk of health effects for everyone. Analysts tallied 135 red days, days when the public may experience health effects. This is an increase over the 2023 findings.
This is the first year that Pittsburgh was not on the list of the 25 worst polluted cities for small particles. No cities in the eastern half of the U.S. made the list.
About 100.6 million Americans live in the 125 counties and 26 states with failing grades for ozone air pollution. Only 207 counties receive A grades. On a positive note, that is 2.4 million fewer people living with unhealthy levels from last year.
The rankings for ozone concentration are also a weighted average, similar to the daily particles.
TOP 10 MOST POLLUTED NATIONAL PARKS
"Cities in the West and the Southwest continue to dominate the list of the most ozone-polluted cities," the report read. "California retains its position of being the state with the most metro areas on the list, with 10 of the 25 most-polluted cities, while the six states of Arizona, Colorado, Nevada, New Mexico, Texas, and Utah accounted for 12 others. They are joined this year by only three more easterly cities; New York, Chicago, and Grand Rapids."
In the report, 55 cities had no high daily particle days, and 76 had zero ozone days. Only five cities came in with zero high particle and ozone days and appeared on the list of the 26 lowest year-round particle levels. The were:
Bangor, Maine.
Johnson City-Kingsport-Bristol, Tennessee and Virginia.
Lincoln-Beatrice, Nebraska.
Honolulu, Hawaii.
Wilmington, North Carolina.
See the charts below to find out if your city is on the list of cleanest cities for daily particle pollution, annual particle pollution and ozone pollution. Only the year-round particle pollution cities were ranked.
The EPA measures six air pollutants but the Lung Association's report contains only small particle and ozone pollution: "two of the most dangerous and pervasive air pollutants."
CITIES WITH WORST AIR POLLUTION 2023
Original article source: Which US cities have the dirtiest air? 2024 State of the Air report ranks them

