Was UNIQA Insurance Group AG’s (VIE:UQA) Earnings Growth Better Than The Industry’s?

When UNIQA Insurance Group AG (VIE:UQA) announced its most recent earnings (31 March 2018), I did two things: looked at its past earnings track record, then look at what is happening in the industry. Understanding how UNIQA Insurance Group performed requires a benchmark rather than trying to assess a standalone number at one point in time. Below is a quick commentary on how I see UQA has performed. Check out our latest analysis for UNIQA Insurance Group
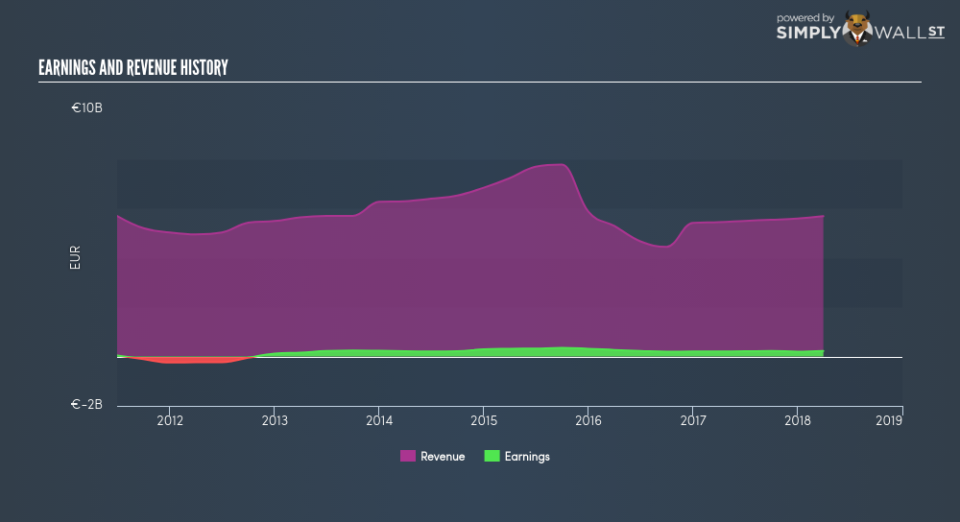
How Well Did UQA Perform?
UQA’s trailing twelve-month earnings (from 31 March 2018) of €222.46m has jumped 10.64% compared to the previous year. However, this one-year growth rate has been lower than its average earnings growth rate over the past 5 years of 25.37%, indicating the rate at which UQA is growing has slowed down. To understand what’s happening, let’s take a look at what’s going on with margins and whether the whole industry is experiencing the hit as well.
Over the last couple of years, revenue growth has failed to keep up which indicates that UNIQA Insurance Group’s bottom line has been driven by unsustainable cost-cutting. Eyeballing growth from a sector-level, the AT insurance industry has been relatively flat in terms of earnings growth over the past few years. This means whatever recent headwind the industry is enduring, UNIQA Insurance Group is relatively better-cushioned than its peers.
In terms of returns from investment, UNIQA Insurance Group has not invested its equity funds well, leading to a 6.98% return on equity (ROE), below the sensible minimum of 20%. However, its return on assets (ROA) of 0.95% exceeds the AT Insurance industry of 0.84%, indicating UNIQA Insurance Group has used its assets more efficiently. Though, its return on capital (ROC), which also accounts for UNIQA Insurance Group’s debt level, has declined over the past 3 years from 1.46% to 0.98%. This correlates with an increase in debt holding, with debt-to-equity ratio rising from 21.78% to 27.89% over the past 5 years.
What does this mean?
Though UNIQA Insurance Group’s past data is helpful, it is only one aspect of my investment thesis. Positive growth and profitability are what investors like to see in a company’s track record, but how do we properly assess sustainability? I recommend you continue to research UNIQA Insurance Group to get a better picture of the stock by looking at:
Future Outlook: What are well-informed industry analysts predicting for UQA’s future growth? Take a look at our free research report of analyst consensus for UQA’s outlook.
Financial Health: Is UQA’s operations financially sustainable? Balance sheets can be hard to analyze, which is why we’ve done it for you. Check out our financial health checks here.
Other High-Performing Stocks: Are there other stocks that provide better prospects with proven track records? Explore our free list of these great stocks here.
NB: Figures in this article are calculated using data from the trailing twelve months from 31 March 2018. This may not be consistent with full year annual report figures.
To help readers see pass the short term volatility of the financial market, we aim to bring you a long-term focused research analysis purely driven by fundamental data. Note that our analysis does not factor in the latest price sensitive company announcements.
The author is an independent contributor and at the time of publication had no position in the stocks mentioned.

