Two charts that prove the glass is half-empty for stocks
Despite a Washington backdrop that continues to drag on investor sentiment, markets around the world have powered higher following a brief reset after the leak of former FBI Director James Comey’s memo.
Stock leadership continues to narrow into a handful of names—not that dissimilar to the 1970’s “Nifty Fifty,” which at the time were considered to be the only stocks you’d ever need to own. In 1972, McDonald’s (MCD) traded at 71x earnings while Sears (S), a bargain, changed hands at 29x. Of course, also on the list were a few stocks no longer with us, such as Polaroid and Eastman Kodak (EK).
There’s still a long runway of growth ahead for some of today’s favorites, so the ride can last for some time. However, crowded trades often end badly just about the time you are convinced there is a new paradigm.
Given the deteriorating technical outlook I describe below, the best outcome would be a pause in the high momentum trade, giving FANG (FB) ,(AMZN), (NFLX) and (GOOGL, GOOG) a rest while the rest of the market narrows the gap. Without it, expect something more violent later in the year.
The good news
We’ve just come through one of the best earnings seasons in some time, and unlike other years, it wasn’t just driven by financial engineering. Not only did we see earnings growth and strong guidance, but real revenue growth. You can do a lot to fudge the numbers on the bottom line, but there’s little you can do with revenue unless you are cooking the books.
Concerns
Corporate America is still looking to Washington before they put CAPEX plans into full gear. Some CEOs want a sense of certainty regarding tax reform and regulatory relief to understand just how to deploy capital. Given the pending investigations and a summer of hearings, any tax reform legislation is likely 2018 business. While there’s strong support on both sides of the aisle for a revamp of the code, there’s little consensus on just what to do.
The current code encourages corporations to offshore their manufacturing and cash flow—and for some, to even offshore where they’re domiciled. A good portion of the post-election rally was based on addressing these issues, so the delay is a concern.
NYSE Bullish Percent Index
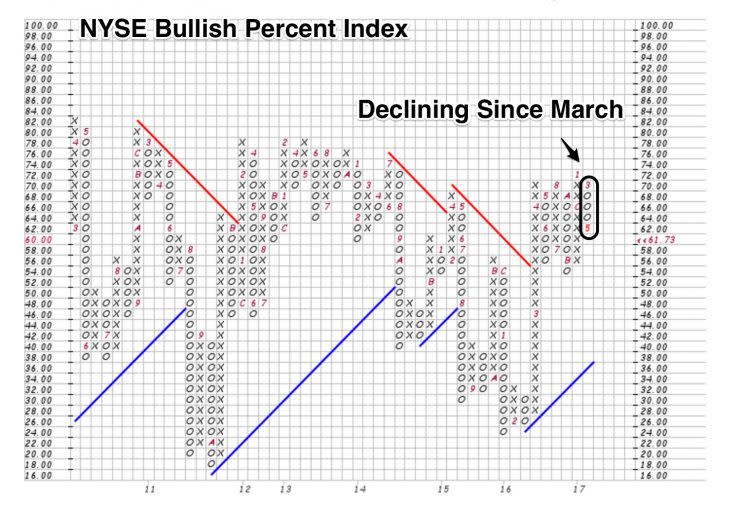
The NYSE bullish percent index reversed to the downside in March and continues to weaken. The index is a measure of the percentage of stocks on a buy signal on a point and figure chart. It’s been falling for months, indicating the market is being supported by fewer and fewer stocks.
S&P 500 vs percent of stocks above 200-day moving average
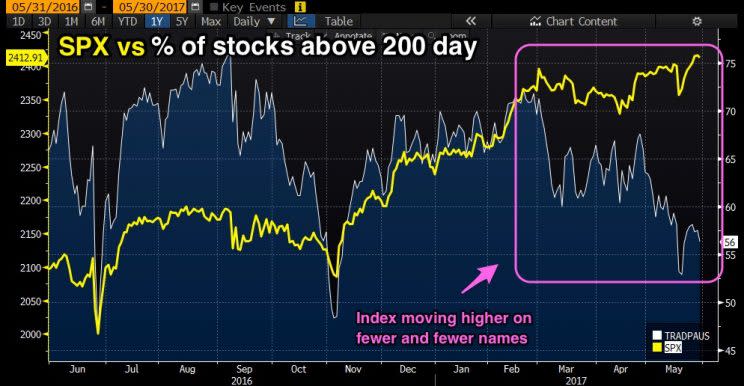
Add the fact that the percentage of stocks above their 200-day moving has been falling steadily since the February high, and it becomes clear the glass of water is morphing from half-full to half-empty.
*At the time of this article, some funds managed by David Nelson were long SPY.
————————————————-
Please contact your Belpointe investment advisor representative if there are any changes in your financial situation or investment objectives.
Investment advice is offered through Belpointe Asset Management, LLC. Past performance is no guarantee of future returns. Insurance products are offered through Belpointe Insurance, LLC and Belpointe Specialty Insurance, LLC. It is important to read our email disclosures available at this link: http://belpointe.com/disclosures.

