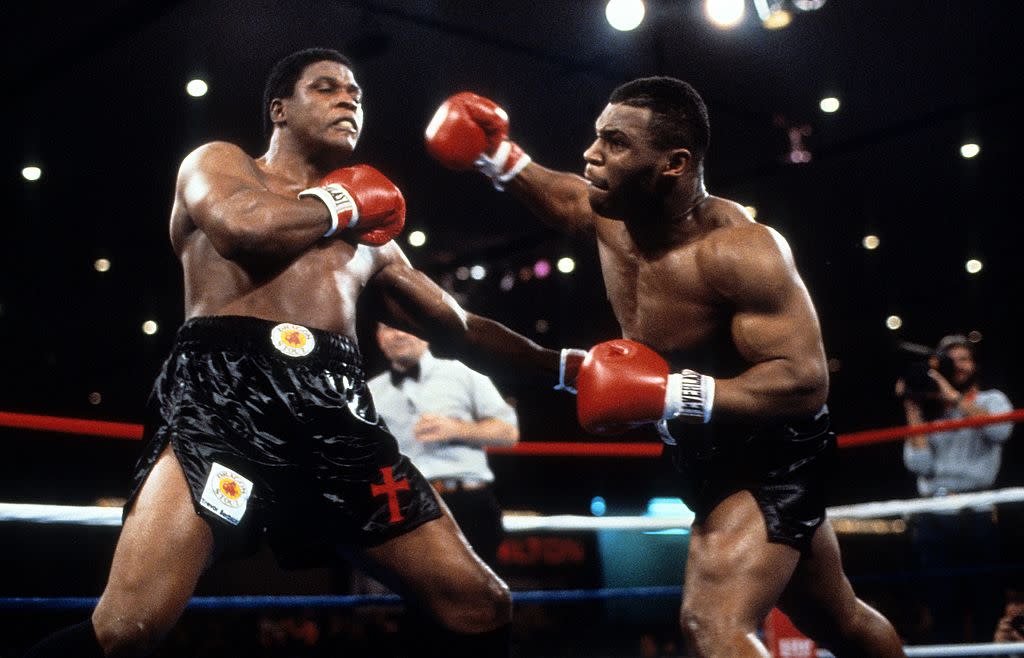
Most traders feel punched in the jaw

David Nelson, CFA, is the Chief Strategist of Belpointe Asset Management
A punch square in the jaw from Mike Tyson is probably how most traders felt when they rang the closing bell Friday. Down at the open after a better than expected jobs number, good news became bad news as investors feared the Federal Reserve might accelerate their tightening policy. Add the fact that President Donald Trump gave the go ahead for the release of a controversial memo on the FBI and FISA warrants issued during the run up to the 2016 election and volatility came roaring back with the averages ending at the low of the day. Now after the first more than 3% sell off in record 301 trading days we’re about to find out just how much stamina the market has in the face of rising rates.

We’re coming to the end of an experiment the Fed put into play when they stepped in to shore up the financial system a decade ago. We’ve long known the path to normalization was in front of us but now for the second time in four years the long end of the curve is throwing a tantrum with the 30-year above 3% and the 10-year threatening to join.
What does it mean for markets and investors?
In a rising rate environment, the character of the market changes. The tide isn’t going to lift all boats anymore. Any student of the market would have to agree Federal Reserve Policy helped drive asset prices higher across the board. Stocks, bonds, real estate etc. we’re all helped by the artificially lowered rates. Today’s rising yields take multiple expansion off the table. Stocks valuations don’t live in a vacuum. Without ultra-low rates and the help of the Fed investors are going to have to make money the old-fashioned way. They’re going to have to “earn it.”

The good news is we have a lot of help. Fundamentals continue to improve along with an economy that has broken out of a near decade long malaise. Rising wages and GDP estimates point to acceleration but therein lies the problem for the Fed. With employment at the best levels in years and inflation starting to pick up, the Fed will continue hiking rates at a measured pace to deal with the other side of their dual mandate while also stocking up on ammunition for the next downturn.
The massive sector rotations in the last couple of weeks in hindsight were the canary in the coal mine. Investors were groping for the path forward uncertain as to which part of the ship to hide. With decliners outpacing advances Friday over 8:1, it’s fair to say almost everyone got wet.
If you’re on my side of the camp believing this is a pull back or correction in an ongoing bull market you start asking what will be some of the signs that it has run its course. Let’s deal with Monday first. Regardless of what happens at the start, the close will be a lot more important than the open.

The current treasury curve in comparison to a year ago highlights concern the curve is flattening, often an indicator of a coming recession. However, recent action in 10- and 30-year paper shows the accelerating economy and inflation are putting upward pressure on the long end as well. The Fed isn’t blind with several members mentioning the flattening curve in press releases. I suspect that with additional flattening the Fed will adjust their pace to be more in line with the ascent at the long end of the curve.

Bottoms are a process and this one likely won’t be any different. In bull markets volatility usually takes a back seat spending the majority of the time near the low end of the range. In the past five years there have been several attempts to push higher with most stalling just above 20 with only a handful making it above 30. Hard to know just how high the spike would have been during the flash crash if the markets had functioned properly. On that day there were 1,278 trading halts for 471 ETFs and stocks. In last year’s article discussing the event Barron’s pointed out that since then NYSE, NASDAQ, and Bats filed amendments to deal with some of the issues that may have contributed to the problem. With last week’s VIX close just above 17 it would appear there is more selling ahead before the weak holders are flushed out.

Reversion to the mean is a powerful force and despite last week’s drubbing the S&P 500 (SPX) hasn’t even touched the 50-day moving average a likely first test.
None of the above are absolutes. Battles are fluid both in the military and on Wall Street. Plans need to be adjusted as conditions change. In 1891 Field Marshall Helmuth von Moltke said “No plan survives first contact with the enemy.” Tyson understood that and investors should too.

