Stocks Plummet as Brexit Looms
- By James Li
On June 23, the United Kingdom voted in a referendum in favor of leaving the European Union. Known as "Brexit," the U.K.'s secession from the EU tormented stock markets globally. Among the stocks that tumbled due to Brexit, global banks and airline companies suffered the most.
The vote heard 'round the world
Since 1973, Great Britain has been a member of the EU and its precursor, the European Economic Community (EEC). However, two years later, the first attempt to secede from the EEC failed, as the electorate voted 67.2% to 32.8% to stay in the EEC. After several failed attempts to earn parliamentary seats, one political party, the United Kingdom Independence Party (UKIP), finally earned a parliamentary seat. Additionally, Prime Minister David Cameron won the 2015 general election.
Warning! GuruFocus has detected 3 Warning Signs with MS. Click here to check it out.
The intrinsic value of MS
After winning the election, Cameron announced the referendum on the U.K.'s membership in the EU. Throughout the day, British citizens queued up in large swarms and voted on the referendum, which ultimately resulted in a 51.89% to 48.11% vote in favor of secession. While initial reports suggest that Britain will stay in the EU, the final votes proved otherwise. Immediately following the vote, the U.S. and U.K. stock markets faltered. The price of British pounds tumbled to a new low, and the Dow dropped nearly 500 points when the markets opened. Additionally, the Nasdaq gave up 3.65% while the Standard and Poor's 500 index declined nearly 3%. The U.S./U.K. exchange rate decreased likely due to the sharp decline in British pound prices.
Global banks and airline companies suffer huge drops in stock price
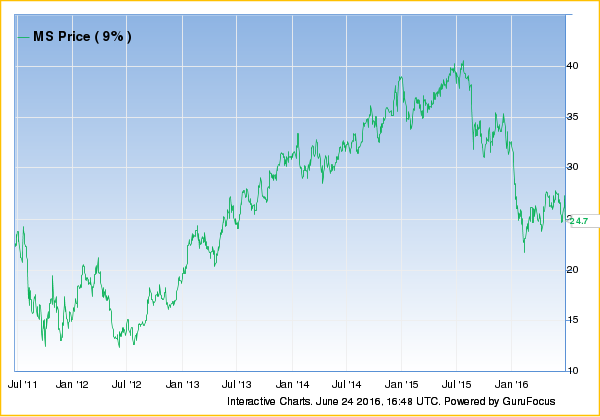
While the U.S. stock market tanked after the Brexit vote, banks and airline companies suffered the worst declines in stock prices. Among the "systematically important financial institutions" or SIFIs, Citigroup Inc. (NYSE:C) and Morgan Stanley (MS) lost over 9% of their stock prices. Other banks, like Bank of America Corp. (BAC), Goldman Sachs Group Inc. (GS) and JPMorgan Chase Co. (JPM), gave up over 6% of their stock prices.
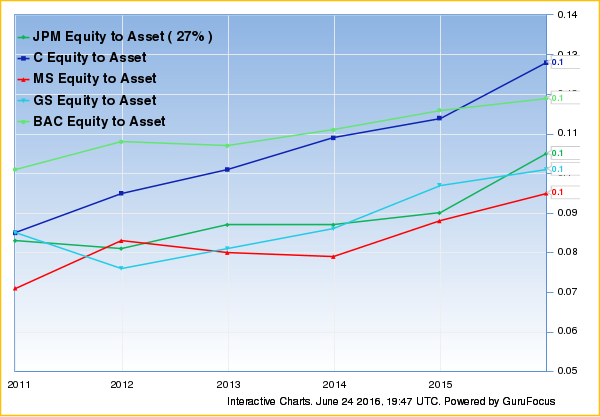
These banks have modest financial strength: Their interest coverage and equity to asset ratios are very low compared to typical growing companies. The only bank to have a return on invested capital higher than its WACC, JPM has the highest interest coverage among the SIFIs. Additionally, JPM's interest coverage currently outperforms 74% of global banks. Despite having high interest coverage, JPM does not have the highest equity-to-asset (E/A) ratio. Currently, Citigroup has a slightly higher E/A ratio than Bank of America, which historically had the lowest leverage.
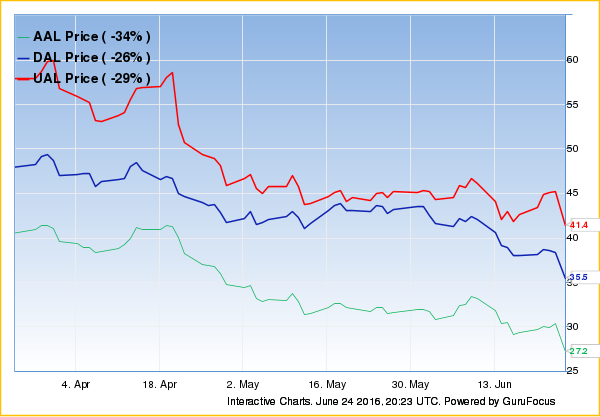
U.S. airline companies also tanked following Brexit. American Airlines Group Inc. (AAL) tumbled 10.35%, worse than Delta Air Lines Inc. (DAL) and United Continental Holdings Inc. (UAL), which declined 7.48% and 8.41%.
Among the top three U.S. airline companies, American Airlines has the worst equity-to-asset ratio, interest coverage and Altman Z-score. With an interest coverage of 6.95, lower than 54% of global airline companies, American Airlines barely meets Ben Graham's requirement of 5. While the top three airline companies all have Z-scores in distress zones, American's Z-score is the lowest at 1.29. Worse, American's equity-to-asset ratio currently underperforms 85% of global airline companies. These financial strength metrics suggest that American Airlines is most likely to go bankrupt throughout the Brexit process.
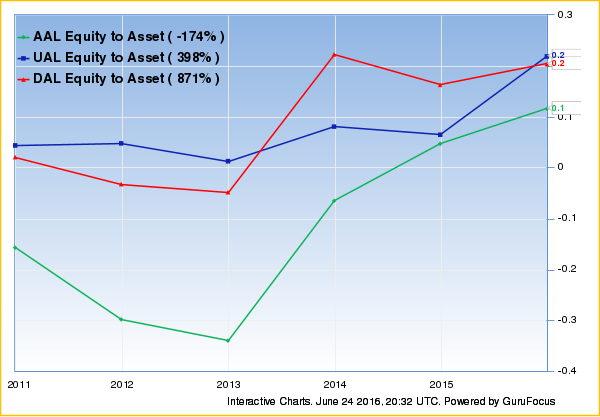
On the other hand, Delta has the strongest financial outlook among the top three U.S. airline companies. Currently, Delta's interest coverage of 17.38 outperforms 69% of global airlines companies, suggesting that the Skyteam airline can easily pay interest expenses. Delta also has the lowest Beneish M-score, suggesting that the company is the least likely to manipulate its earnings results. Additionally, among these three airline companies, Delta has the highest Piotroski F-score, a 7 out of 9. Although United has equity-to-asset ratios similar to Delta, United has lower interest coverage and a higher Beneish M-score. United is also the only airline company among these three that possibly manipulated its earnings.
All-in-One Screener picks Brexit stocks with ease
With over 120 different filters, the All-in-One Guru Screener allows users to generate their personalized screeners to search for stocks. These filters are conveniently organized into separate tabs depending on their financial metric: fundamental, valuation ratio, profitability, growth, valuation rank, price, dividends, gurus and insiders. Red numbers next to each tab indicate how many active filters have been selected in each of the tabs. Additionally, users can create their own financial metrics using the "Customized" tab by typing in the formula in the large box after pressing "Create New Filter."
The All-in-One Screener comes with several predefined screens. Additionally, users can save their personalized screens by naming them and clicking the save button just above the screener results. For example, a sample "Brexit Banks N Airlines" Screener contains the following filters:
Price: Today's change is less than -5%.
Market cap greater than $10 billion.
The stock is either in the global banking or airline industry.
The stock trades in the U.S.


The "Brexit Banks N Airlines" Screener lists 11 stocks that suffered sharply from Britain's vote to secede from the EU. While American Airlines plummeted the most among airline stocks, Charles Schwab Corp. (SCHW) experienced the worst stock price decline among the 11 stocks listed on the screener.
The default tab for the "Screener Results" section is the "Active Filters" tab. As its name suggests, only the filters applied are listed in the results section. To see more filters, users can either select more filters or simply click on one of the tabs listed to the left of the "Active Filters" tab. Each of these tabs provides different financial metrics, and these correspond to the tabs listed on the screener above. An earlier article summarizes the key financial metrics that each tab provides.
Users are encouraged to explore the powerful All-in-One Screener, which is only available to Premium members. Therefore, it is highly recommended that users sign up for a free trial.
Disclosure: I currently do not own any of the stocks discussed in this article.
Start a free seven-day trial of Premium Membership to GuruFocus.
This article first appeared on GuruFocus.
Warning! GuruFocus has detected 3 Warning Signs with MS. Click here to check it out.
The intrinsic value of MS
