Stocks aren't out of the woods just yet: trader
US equity markets (^GSPC, ^IXIC, ^DJI) regain composure after a mid-week FOMC minutes induced test to the downside
US equities post a relatively flat weekly performance in large part due to Thursday’s dramatic reversal and end of week following through on Friday.
The CBOE Volatility Index slips 11.81% on the week to end at 16.49.
The CBOE 10-year yield posted a relatively flat weekly performance closing at 2.87%.
Crude oil bounces off $60/bbl support to post a solid gain on the week closing at $63.55/bbl.
The principal drivers of equity market direction are economic health and corporate earnings, and last week provided a largely encouraging backdrop for investors in that regard. Additionally, the panic attack in equity markets that was triggered by fear over a dramatic uptick of inflation seems to have receded — if last week’s performance of the 10-yearr yield is any indication.
Last week we received the Leading Indicators results for January. They reflected solid growth coming in at 1.0% versus Bloomberg consensus that was calling for 0.6%. Underscoring the report’s strength were surging building permits, continued moves higher is equity markets and a solid ISM New Orders Index. Of particular importance in regards this specific report, Leading Indicators is forward-looking and suggests that the trend for U.S. economic growth moving forward is constructive.
Weekly jobless claims, for the week ending 2/17, were once again very solid. New claims came in at 222K, bringing the 4-week moving average incrementally lower, to 226K.
The PMI Composite Flash for February was a stronger-than-expected 55.9 versus Bloomberg consensus’s 54.0. January’s reading was 53.8. Both the manufacturing and services sectors of the report contributed to the results. Of particular importance was the surge in manufacturing strength in the period.

One of the most encouraging aspects of this resurgent economy has been manufacturing. Last week the Kansas City Fed Manufacturing Index for February was released. Bloomberg consensus was calling for a reading of 16.5. It was 17. Federal Reserve manufacturing results across the country, in every region, have reflected a renaissance in recent quarters, the likes of which we have not seen in several decades. As a point of reference, two years ago, in February of 2016, this data point was 12.
Despite the constructive narrative laid out by the economic data, investors did suffer a bout of panic on Wednesday with the release of the FOMC Minutes from the January meeting. Interestingly, there was virtually nothing in the minutes that reflected any change in the interest rate outlook by the FOMC. Rather, equity traders hit the “sell button” at the realization that the Fed confirmed it’s tightening bias moving forward. Short term traders were clearly expecting the confirmation of that Fed bias to trigger a greater degree of panic than actually materialized in the market. The reversal lower on Wednesday that could have spelled trouble for our recent rebound in equity prices evaporated in short order on Thursday as investors once again bought the dip. In the process, equity markets finished the week on a solidly positive note by posting very strong gains on both Thursday and Friday. Those gains were underscored by very solid advance/decline figures.
Crude’s Reversal
WTI crude oil (CL=F) found a bid last week. It closed out the week with a solid gain closing at $63.55.bbl. As expected, support at the $60/bbl level, found in the previous week, was augmented by a drop in weekly EIA Petroleum Status results. For the week ending 2/16, crude oil inventories dropped by 1.6 M bbls. Additionally, distillates saw a draw of 2.24 M bbls. Though gasoline inventories rose a modest 0.3M bbls in the week, the takeaway was that there was no meaningful change to inventories. Adding additional support to the move higher at week end was the contraction reflected in the Baker-Hughes Rig Count. For the week ending 2/23, North American rig counts slipped to 1284 from the previous week’s 1293.
The “Temperance” I was expecting in last week’s trade did manifest in that equities posted a modest increase in prices, week-to-week. The 10-yr. traded in a relatively tight range, crude prices did find a bid and volatility fell significantly.
This week’s very busy economic calendar will provide further evidence of sustainable economic expansion. Manufacturing data from the Dallas and Chicago Fed, as well as New Home Sales, will highlight Monday’s calendar. Durable Goods Orders, International Trade, Retail Inventories, house price data and consumer confidence will drive Tuesday’s narrative. The second estimate for Q4 GDP is released on Wednesday. Bloomberg consensus is calling for 2.5% annualized versus the initial reading of 2.6%. Investors will be paying close attention to both the Q/Q GDP Price Index (c. 2.4%) and Q/Q Real Consumer Spending (c. 3.7%).
US equities are not out of the woods just yet
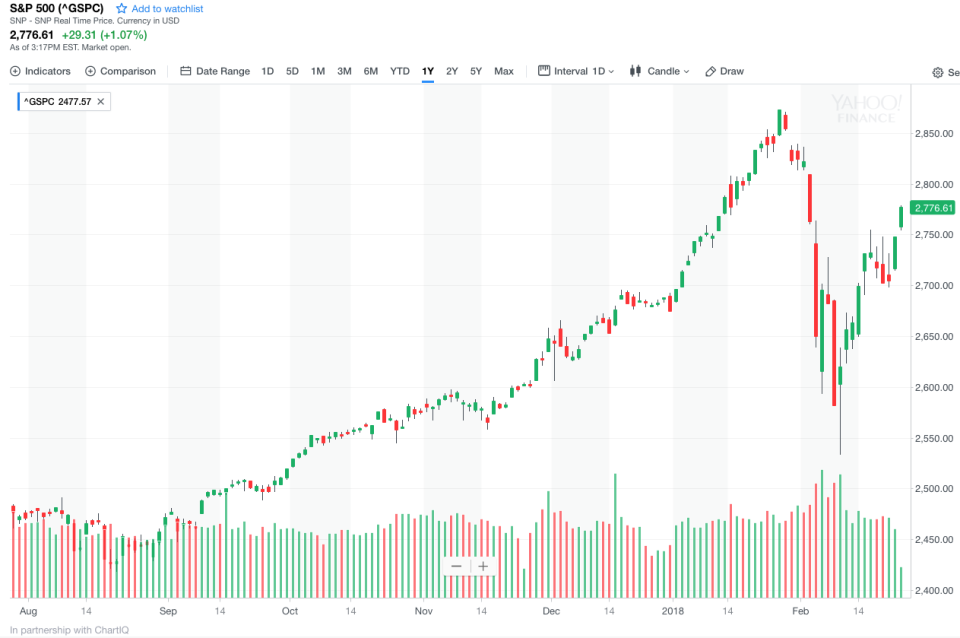
As the chart below illustrates, and using the S&P 500 as a proxy the broader market, the interest rate panic induced selloff that materialized on 1/26 and concluded on 2/9 did reset the investing landscape. The S&P closed out Friday roughly 4% below the all-time high registered on 1/26. As I have suggested in recent notes, a move lower of that magnitude does require a significant amount of work to digest and move beyond.
That work will require investors to reset expectations for earnings, inflation and interest rates and the interplay among them. To a large degree, much of that calculus can be gleaned by looking at valuations. As valuations currently stand, they are stretched. As a result, either earnings results will continue to accelerate and support market multiples or equity prices will fall prey to compression.
As of Friday’s close, the S&P 500 sports a P/E ratio of 22.12, after having gained 18.34% over the past 52-week period. That P/E has been and remains stretched well beyond historical standards. I would argue, as I have since my “Year Ahead” note on January 1, that the enthusiasm that has characterized investor outlook and the subsequent equity market rally is due for a degree of moderation if not containment, in effect that the sledding would be more challenging for investors in 2018.
The selloff that we experienced recently (-10%), coupled with the modest rebound (+6%) that materialized in its aftermath, both speak to a shift in tone and potentially direction in equity markets. The highs that the market registered at the end of January are likely to remain the highs for some time though we may well see some additional marginal gains in coming weeks.
Stretched valuations, shifting metrics of inflation, expectations for further Fed tightening and the need for significant earnings and revenue growth on the part of corporations all add up to a degree of caution in my near-term outlook for US equities. That caution does not reflect a call for an end to the bull market. It does reflect a call for significantly more modest equity market gains in coming weeks – potentially months.
Commentary by Sam Stovall, chief investment strategist at CFRA Research
Stock prices appear to be buoyed by upward adjustments to economic growth and EPS estimates, despite an increase in inflationary expectations and interest rate assumptions. Action Economics (AE) recently made upward revisions to its year-over-year Q4 Core CPI growth rate to 2.0% from the 1.9% estimated earlier. In addition, expectations now call for the yield on the 10-year note to average 3.00% by the final quarter of the year, versus AE’s previous 2.85% year-end forecast and 2.45% level seen at the end of 2017. While the Fed is still likely to raise rates three times this year, AE’s Q4 projection for the FRB U.S. dollar index is a further erosion toward the 85.5 average by the end of the year versus the 88.9 terminal reading at the end of 2017. However, the greatest revision came from S&P Capital IQ’s consensus estimate for the S&P 500’s 2018 EPS: $156 currently from $145 at the end of last year.
Economic Calendar:
Tuesday
8:30 AM Durable Goods Orders
8:30 AM International Trade in Goods
8:30 AM Retail Inventories (Advance)
8:30 AM Wholesale Inventories (Advance)
9:00 AM S&P Corelogic Case-Shiller HPI
9:00 AM FHFA House Price Index
10:00 AM Consumer Confidence
10:00 AM Richmond Fed Manufacturing Index
Jerome Powell, 10:00 AM
Wednesday
7:00 AM MBA Mortgage Applications
8:30 AM GDP
9:45 AM Chicago PMI
10:00 AM Pending Home Sales Index
10:30 AM EIA Petroleum Status report
Thursday
Motor Vehicle Sales
8:30 AM Weekly Jobless Claims
8:30 AM Personal Income and Outlays
9:45 AM PMI Manufacturing Index
9:45 AM Bloomberg Consumer Comfort Index
10:00 AM ISM Mfg. Index
10:00 AM Construction Spending
Jerome Powell, 10:00 AM
William Dudley 11:00 AM
Friday
10:00 AM Consumer Sentiment
1:00 PM Baker-Hughes Rig Count

