Was Satellite Solutions Worldwide Group plc’s (LON:SAT) Earnings Decline Part Of A Broader Industry Downturn?

Examining Satellite Solutions Worldwide Group plc’s (AIM:SAT) past track record of performance is a valuable exercise for investors. It enables us to understand whether the company has met or exceed expectations, which is a powerful signal for future performance. Below, I will assess SAT’s latest performance announced on 31 May 2017 and weigh these figures against its longer term trend and industry movements. View our latest analysis for Satellite Solutions Worldwide Group
Commentary On SAT’s Past Performance
I prefer to use the ‘latest twelve-month’ data, which either annualizes the most recent 6-month earnings update, or in some cases, the most recent annual report is already the latest available financial data. This blend enables me to assess different stocks on a similar basis, using the most relevant data points. For Satellite Solutions Worldwide Group, its latest trailing-twelve-month earnings is -UK£8.11M, which compared to last year’s figure, has become more negative. Since these values may be fairly short-term thinking, I’ve created an annualized five-year value for SAT’s net income, which stands at -UK£4.05M. This doesn’t look much better, since earnings seem to have gradually been getting more and more negative over time.
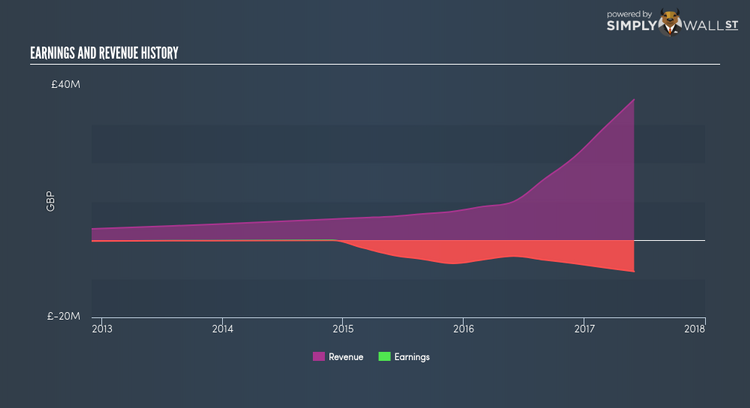
We can further examine Satellite Solutions Worldwide Group’s loss by looking at what the industry has been experiencing over the past few years. Each year, for the last five years Satellite Solutions Worldwide Group’s top-line has risen by 51.36% on average, implying that the company is in a high-growth phase with expenses racing ahead revenues, leading to annual losses. Viewing growth from a sector-level, the UK telecom industry has been enduring some headwinds in the prior twelve months, leading to an average earnings drop of -25.77%. This is a significant change, given that the industry has been delivering a positive rate of 2.79%, on average, over the past half a decade. This shows that whatever near-term headwind the industry is experiencing, it’s hitting Satellite Solutions Worldwide Group harder than its peers.
What does this mean?
Satellite Solutions Worldwide Group’s track record can be a valuable insight into its earnings performance, but it certainly doesn’t tell the whole story. With companies that are currently loss-making, it is always difficult to forecast what will occur going forward, and when. The most valuable step is to assess company-specific issues Satellite Solutions Worldwide Group may be facing and whether management guidance has consistently been met in the past. I recommend you continue to research Satellite Solutions Worldwide Group to get a better picture of the stock by looking at the areas below. Just a heads up – to access some parts of the Simply Wall St research tool you might be asked to create a free account, but it takes just one click and the information they provide is definitely worth it in my opinion.
1. Financial Health: Is SAT’s operations financially sustainable? Balance sheets can be hard to analyze, which is why Simply Wall St does it for you. Check out important financial health checks here.
2. Valuation: What is SAT worth today? Is the stock undervalued, even when its growth outlook is factored into its intrinsic value? The intrinsic value infographic in this free research report helps visualize whether SAT is currently mispriced by the market.
3. Other High-Performing Stocks: Are there other stocks that provide better prospects with proven track records? Explore a free list of these great stocks here.
NB: Figures in this article are calculated using data from the trailing twelve months from 31 May 2017. This may not be consistent with full year annual report figures.
To help readers see pass the short term volatility of the financial market, we aim to bring you a long-term focused research analysis purely driven by fundamental data. Note that our analysis does not factor in the latest price sensitive company announcements.
The author is an independent contributor and at the time of publication had no position in the stocks mentioned.

