
Russia’s Crude Shipments Rebound to the Highest Level This Year
(Bloomberg) -- Russia’s seaborne crude exports surged to the highest level for the year so far, with shipments from a key Pacific port rebounding after a storm hampered loading operations in the previous week.
Most Read from Bloomberg
Stock Traders Bracing for Worst Shrug Off Hot CPI: Markets Wrap
Ex-Wall Street Banker Takes On AOC in New York Democratic Primary
US Core Inflation Tops Forecasts Again, Reinforcing Fed Caution
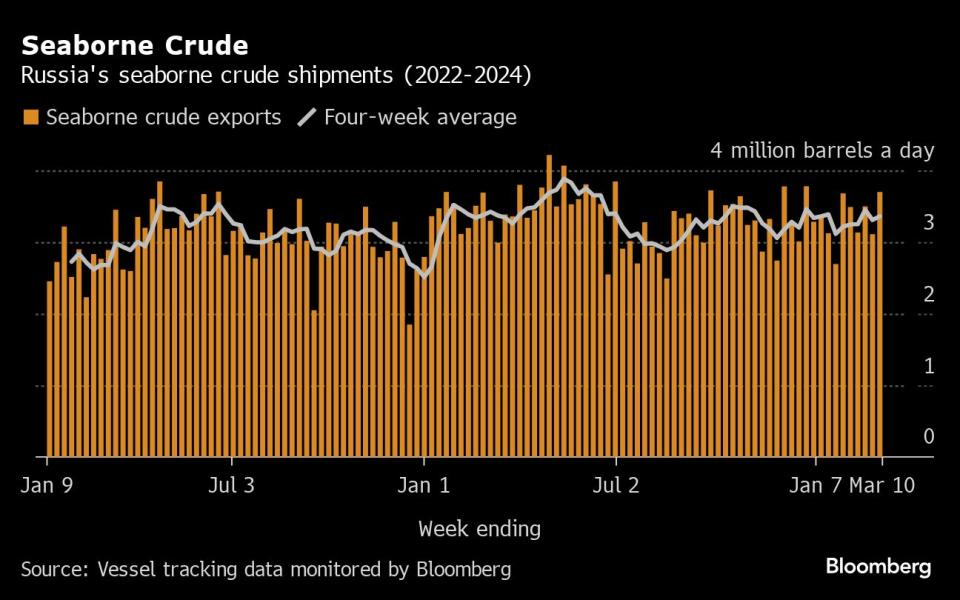
The 590,000-barrels-a-day jump in the week to March 10 came shortly after Moscow renewed its commitment to the OPEC+ effort to avert a global surplus and shore up prices by restricting output. Weekly flows were 420,000 barrels a day above Russia’s pledge to its partners for the first quarter, with the four-week average topping the target by 80,000 barrels a day.
Over the course of the second quarter, the Kremlin plans to move away from export targets in favor of a production cap. The country’s compliance with its current pledge to reduce crude output slipped last month after reaching almost 100% at the start of the year.
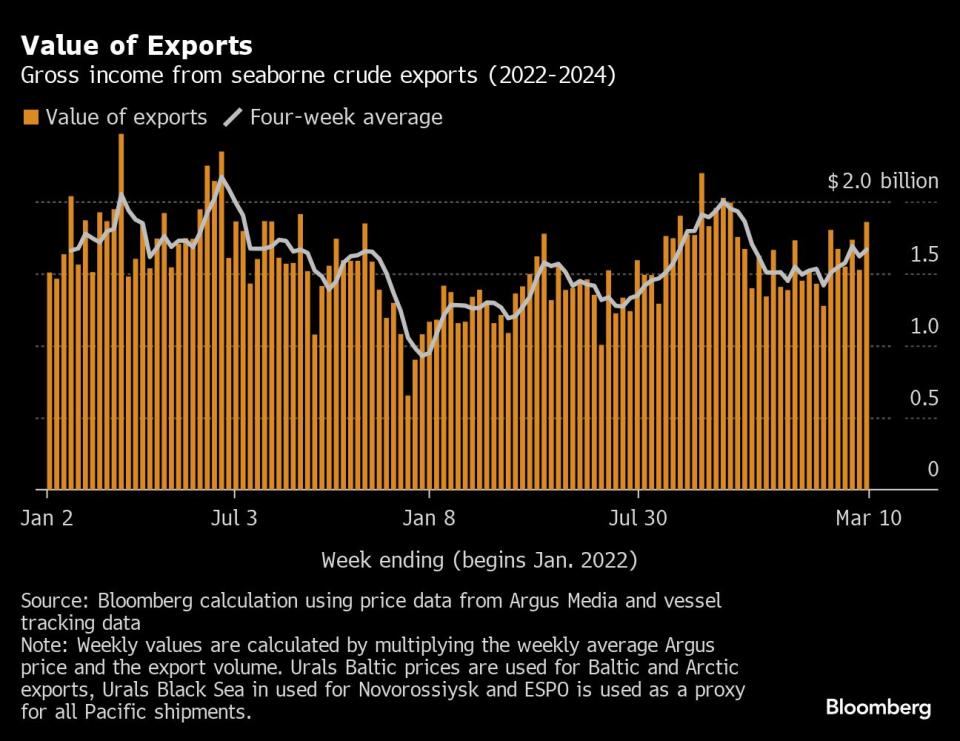
The gross value of crude shipments jumped to the highest since October, rising to $1.86 billion in the seven-day period, despite an international sanctions regime designed to crimp President Vladimir Putin’s ability to finance the war in Ukraine, which has now stretched into a third year.
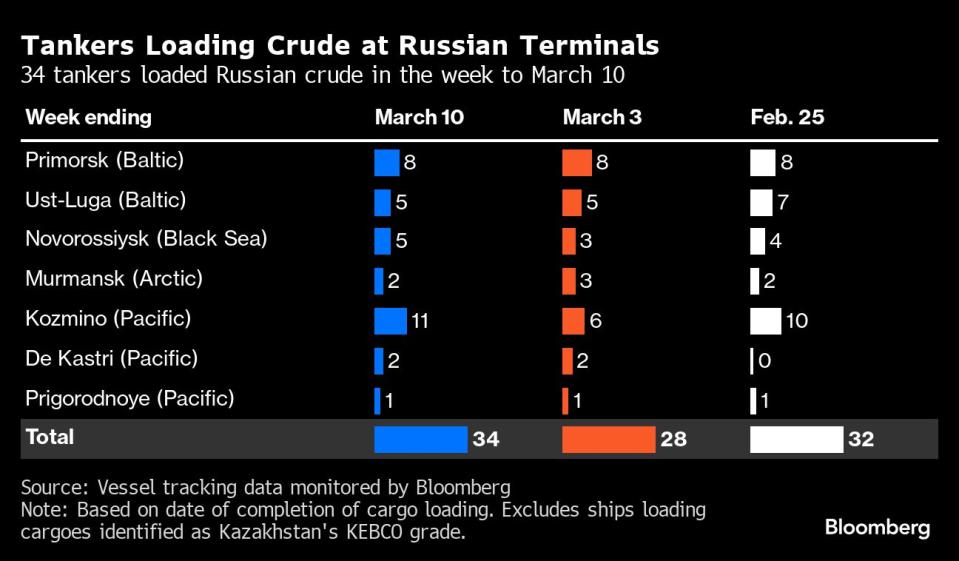
Eleven tankers were loaded at the Pacific port of Kozmino last week. That’s just one fewer than the record number seen in the week to Feb. 4 and up by five from the storm-hit operations of the previous week, when winds reached 40 miles an hour, according to weather data provider visualcrossing.com.
Separately, shipments of Sokol crude from De Kastri, 700 miles further north, have returned to near normal levels, with shuttle tankers making direct deliveries to Chinese refiners, rather than transferring cargoes onto other ships for delivery. Flows to Indian plants remain at a trickle though, with 10.5 million barrels still on tankers idling in the East China Sea, or anchored near China’s ports.
A first Sokol cargo has been delivered to a refinery near Pakistan’s port of Karachi.
The gross value of Russia’s crude exports climbed from a revised $1.53 billion the previous week. The four-week average income also edged higher, rising by about $50 million to $1.66 billion a week.
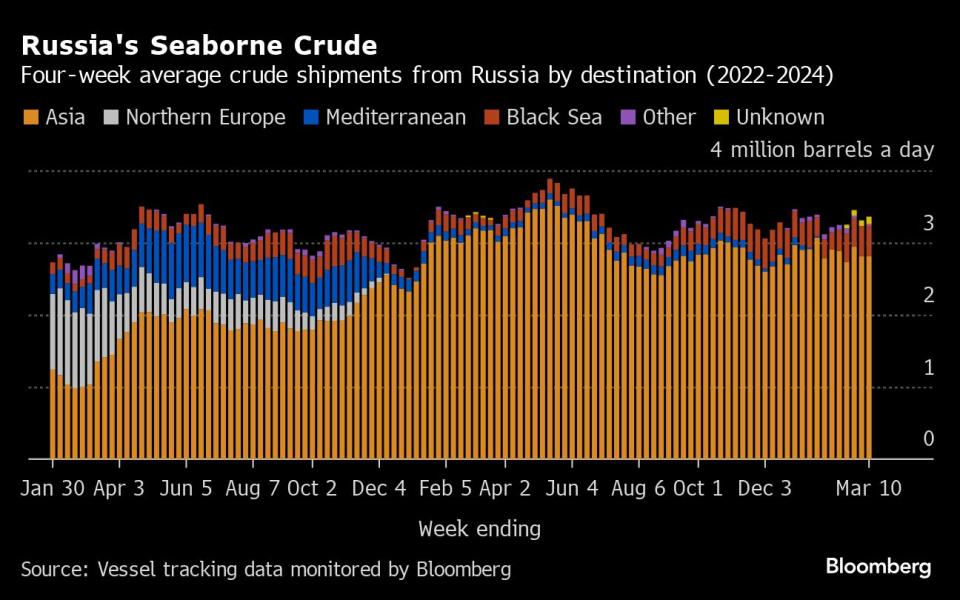
Flows by Destination
Russia’s seaborne crude flows in the week to March 10 climbed to 3.7 million barrels a day, a year-to-date high. The less volatile four-week average also rose, up by about 50,000 barrels a day to 3.36 million barrels a day.
Weekly shipments were about 120,000 barrels a day above the average seen in May and June, or about 420,000 barrels a day above Russia’s first quarter target. The four-week average was about 80,000 barrels a day above the target.
All figures exclude cargoes identified as Kazakhstan’s KEBCO grade. Those are shipments made by KazTransoil JSC that transit Russia for export through the Black Sea port of Novorossiysk and the Baltic’s Ust-Luga and are not subject to European Union sanctions or a price cap.
The Kazakh barrels are blended with crude of Russian origin to create a uniform export grade. Since Russia’s invasion of Ukraine, Kazakhstan has rebranded its cargoes to distinguish them from those shipped by Russian companies.
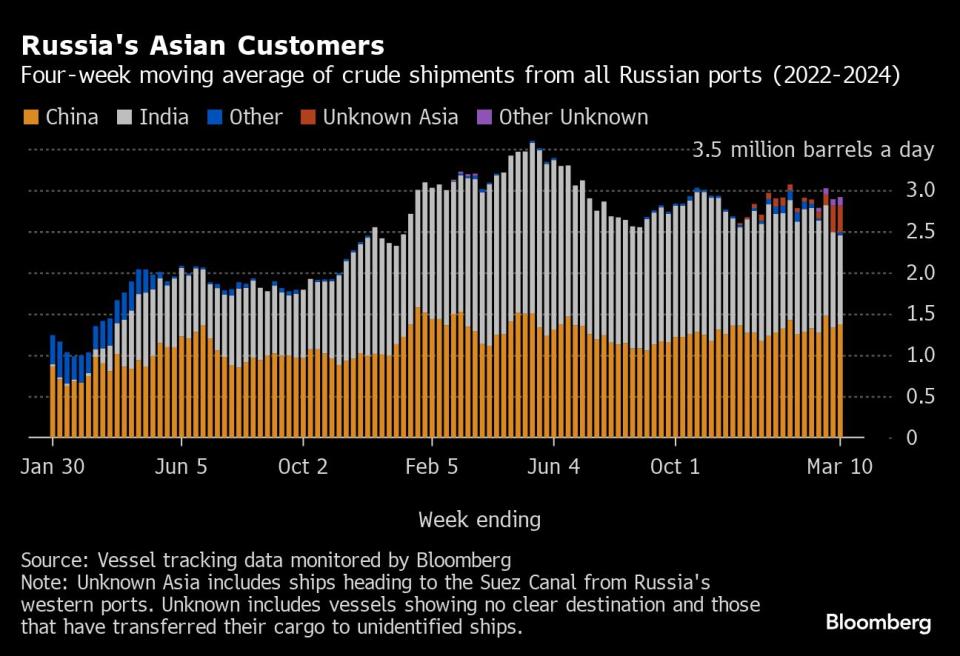
Asia
Most Read from Bloomberg
Observed shipments to Russia’s Asian customers, including those showing no final destination, edged higher to 2.92 million barrels a day in the four weeks to March 10, up from a revised 2.89 million in the previous four-week period.
About 1.37 million barrels a day of crude was loaded onto tankers heading to China. The Asian nation’s seaborne imports are boosted by about 800,000 barrels a day of crude delivered from Russia by pipeline, either directly, or via Kazakhstan.
Flows on ships signaling destinations in India averaged about 1.08 million barrels a day.
Both the Chinese and Indian figures will rise as the discharge ports become clear for vessels that are not currently showing final destinations.
The equivalent of about 320,000 barrels a day was on vessels signaling Port Said or Suez in Egypt, or are expected to be transferred from one ship to another off the South Korean port of Yeosu. Those voyages typically end at ports in India or China and show up in the chart below as “Unknown Asia” until a final destination becomes apparent. This figure includes stranded Sokol crude cargoes that have failed to discharge in India since mid-December.
The “Other Unknown” volumes, running at about 100,000 barrels a day in the four weeks to March 10, are those on tankers showing no clear destination. Most of those cargoes originate from Russia’s western ports and go on to transit the Suez Canal, but some could end up in Turkey. Others could be moved from one vessel to another, with most such transfers now taking place in the Mediterranean, off the coast of Greece.
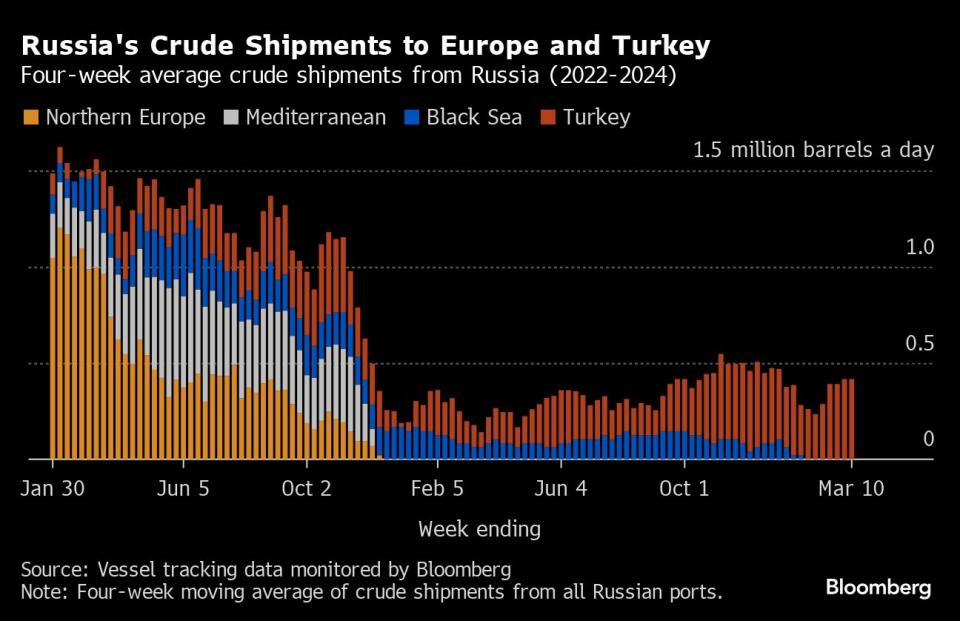
Europe and Turkey
Russia’s seaborne crude exports to European countries have ceased.
With flows to Bulgaria halted at the end of last year, Turkey is now the only short-haul market for shipments from Russia’s western ports.
Exports to Turkey remained steady at about 417,000 barrels a day in the four weeks to March 10. That’s equal to the highest since the week ended Dec. 5 and up from about 390,000 barrels a day in the period to Feb. 25.
Vessel-tracking data are cross-checked against port agent reports as well as flows and ship movements reported by other information providers including Kpler and Vortexa Ltd.
Export Value
Following the abolition of export duty on Russian crude, we have begun to track the gross value of seaborne crude exports, using Argus Media price data and our own tanker tracking.
The gross value of Russia’s crude exports soared to the highest since October, jumping to $1.86 billion in the seven days to March 10 from a revised $1.53 billion the previous week. Meanwhile four-week average income edged higher, rising by about $50 million to $1.66 billion a week. The four-week average is still well off its peak of $2.17 billion a week, reached in the period to June 19, 2022. The highest it reached last year was $2 billion a week in the period to Oct. 22.
During the first four weeks after the Group of Seven nations’ price cap on Russian crude exports came into effect in early December 2022, the value of seaborne flows fell to a low of $930 million a week, but soon recovered.
The chart above shows a gross value of Russia’s seaborne oil exports on a weekly and four-week average basis. The value is calculated by multiplying the average weekly crude price from Argus Media Group by the weekly export flow from each port. For shipments from the Baltic and Arctic ports we use the Urals FOB Primorsk dated, London close, midpoint price. For shipments from the Black Sea we use the Urals Med Aframax FOB Novorossiysk dated, London close, midpoint price. For Pacific shipments we use the ESPO blend FOB Kozmino prompt, Singapore close, midpoint price.
Export duty was abolished at the end of 2023 as part of Russia’s long-running tax reform plans.
Ships Leaving Russian Ports
The following table shows the number of ships leaving each export terminal.
A total of 34 tankers loaded 25.9 million barrels of Russian crude in the week to March 10, vessel-tracking data and port agent reports show. That was up by about 4.1 million barrels from the previous week and the highest so far this year.
Shipments from Russia’s Pacific terminal at Kozmino rebounded from the previous week’s storm-hit level to reach a five-week high.
All figures exclude cargoes identified as Kazakhstan’s KEBCO grade. One cargo of KEBCO was loaded at Ust-Luga a during the week.
NOTES
Note: This story forms part of a weekly series tracking shipments of crude from Russian export terminals and the gross value of those flows. Weeks run from Monday to Sunday. The next update will be on Wednesday, March 20.
Note: All figures exclude cargoes owned by Kazakhstan’s KazTransOil JSC, which transit Russia and are shipped from Novorossiysk and Ust-Luga as KEBCO grade crude.
If you are reading this story on the Bloomberg terminal, click here for a link to a PDF file of four-week average flows from Russia to key destinations.
--With assistance from Sherry Su.
Most Read from Bloomberg Businessweek
Gold-Medalist Coders Build an AI That Can Do Their Job for Them
Academics Question ESG Studies That Helped Fuel Investing Boom
Luxury Postnatal Retreats Draw Affluent Parents Around the US
Primaries Show Candidates Can Win on TikTok But Lose at the Polls
How Apple Sank About $1 Billion a Year Into a Car It Never Built
©2024 Bloomberg L.P.
