How to Read a Candlestick Chart
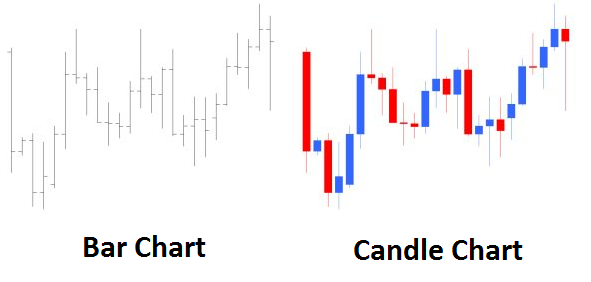
Technical traders are confronted with many choices when it comes to charting. More often than not Forex charts are defaulted with candlestick charts which differ greatly from the more traditional bar chart often used in other markets. Surprisingly after learning to analyze candlesticks, traders often find they are able to quickly identify different types of price action they could not pinpoint before with traditional charts.
Finding these points can help give a trader an advantage when planning a trading strategy. So let’s get started learning about how to read a candlestick chart!
How to Read Candles
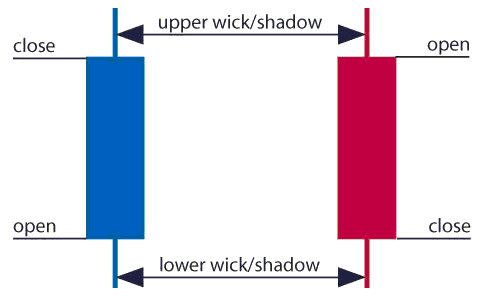
The image below represents the design of a typical candlestick. There are three specific points (open, close, wicks) that are used in the creation of a price candle. The first points we need to consider are the candles open and close prices. These points identify where price began and concluded for a selected period and will construct the body of a candle. It is important to note the color of the body of a candlestick (red for down and blue for up). Knowing this, candlesticks can help us quickly identify if the market is trading higher or lower for a selected period.
Next we have the wicks of our candlesticks, which can also be referred to as a shadow. These points are vital as they show the extremes in price for a specific charting period. The wicks are quickly identifiable as they are visually thinner than the body of the candlestick. This is where the strength of candlesticks becomes apparent. Candlesticks can help us keep our eye on market momentum and away from the static of price extremes.
Uses in Trading
Once you can read the basics of a candlestick chart, they can open up an array of trading opportunities. While a trader may not employ candlestick analysis alone in their strategies, it can help give us clues into market sentiment and direction. Forex professionals are known to look for specific patterns or a series of candlesticks to gauge future price movement and set trading orders. Throughout the month of August, we will continue our discussion on candlestick charts and look at specific candle patterns for market reversals and continuations.
---Written by Walker England, Trading Instructor
To contact Walker, emailwengland@fxcm.com. Follow me on Twitter at @WEnglandFX.
To be added to Walker’s e-mail distribution list, send an email with the subject line “Distribution List” to wengland@fxcm.com.
New to the FX market? Register and take this free 20 minute “New to FX” course presented by DailyFX Education. In the course, you will learn about the basics of a forex transaction, what is leverage, and how to determine an appropriate amount of leverage for your trading. Register HERE to start your FOREX trading now!
DailyFX providesforex newson the economic reports and political events that influence the currency market. Learncurrency tradingwith a free practice account and charts from FXCM.
