Peter Lynch LUVs Southwest Airlines
- By James Li
On Oct. 26, Southwest Airlines Co. (LUV) discussed their third quarter earnings performance in a current report filing with the Securities and Exchange Commission. Even though the company missed revenue per available seat mile (RASM) expectations, Southwest remains one of Peter Lynch's undervalued growth stocks. Three airlines, including Southwest, made the "Lynch and Yacktman Airlines" screener.
Warning! GuruFocus has detected 1 Warning Sign with LUV. Click here to check it out.
The intrinsic value of LUV
Earnings report suggests weakening financial outlook
Southwest reported net income of $388 million and diluted earnings per share of 62 cents in their fiscal quarter ending Sept. 30. Both values significantly underperform comparative values in the third quarter of 2015, likely due to the July technology glitch that canceled over 2000 flights. Despite this, CEO Gary C. Kelly still praised the company's management for producing "strong cash flows and healthy margins."
Excluding the nonrecurring revenue adjustment of $172 million with JPMorgan Chase & Co. (JPM), Southwest's third quarter operating revenue compares to the third quarter operating revenues for 2015. However, the operating RASM declined 4.1% and is expected to decrease further in the fourth quarter based on current booking trends.
Likely due to the weakening financial outlook, Southwest's stock price took a 10.13% nosedive from its Oct. 25 closing price of $41.95. The company traded at $37.70 per share when the market opened Oct. 26.

Company among Peter Lynch growth stocks despite poor earnings
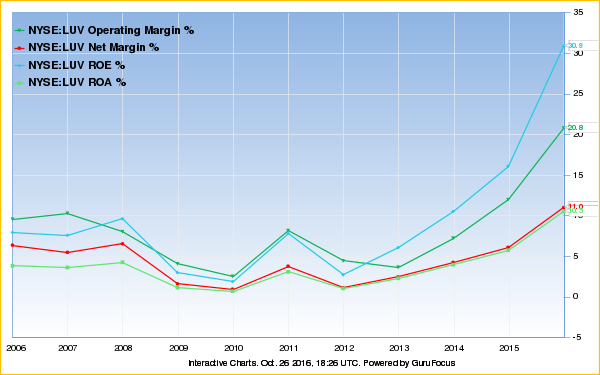
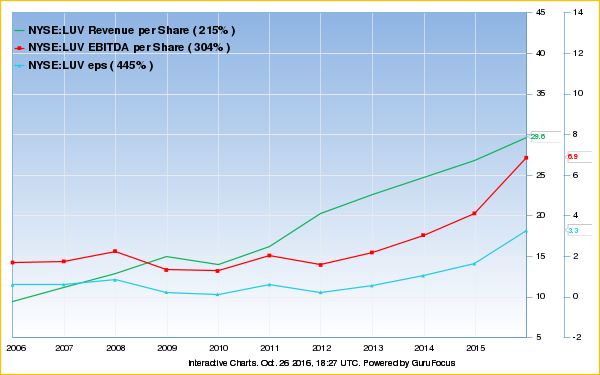
Despite the poor earnings outlook, Southwest still has a financial strength rank of 6 and a profitability rank of 8. The Dallas-based airline's profit margins and returns are near a 10-year high, and its operating margin and return on equity outperform 90% and 72% of global airlines, respectively. Southwest also has historically high three-year EBITDA growth and three-year earnings per share growth.
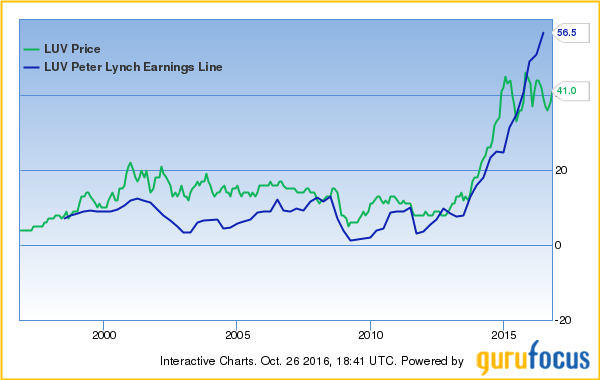
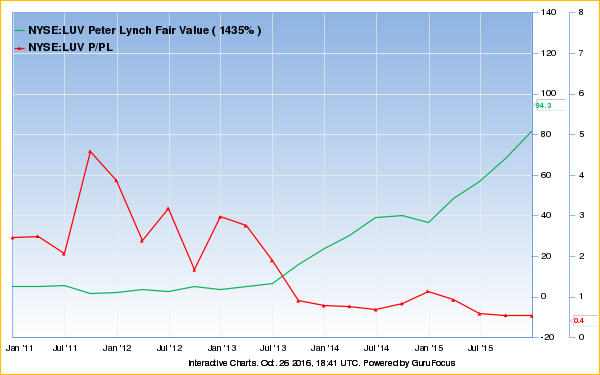
The Dallas airline's trailing 12 month price-earnings ratio is near a 10-year low albeit ranking lower than 61% of global airlines. As of Oct. 26, Southwest trades below its Peter Lynch Chart and Peter Lynch fair value. Since the company's five-year earnings growth rate is greater than 25%, we calculate the Lynch value using 25 for the growth rate. The company's Lynch value increased quarter over quarter during the past five years, dragging Southwest's price-to Peter Lynch value near a 10-year low.
Southwest's management mentioned "exciting growth opportunities" for fiscal 2017 in the earnings report. The company plans to prudently monitor growth through reduction of ASM growth to about 4%, with about 2% related to domestic ASM growth. Additionally, the airline expects to launch service from Florida to Cuba and from Los Angeles to Mexico.
Other press releases shed light on Southwest's high growth potential. As mentioned in an Oct. 3 press release, the Logistics Management awarded the Dallas airline the Quest for Quality Award year over year for two decades for displaying the "ultimate model of consistency": high customer satisfaction, performance excellence and commitment to technology operations.
Additionally, the Dallas airline maintained a steadily increasing dividend for 160 consecutive quarters as mentioned in a July 28 press release. The company's five-year dividend growth rate is 72.7% with a yield on cost of 12.75%, the latter outperforming 90% of global airlines. Additionally, the company's trailing dividend yield of 0.91% is near a 10-year high.


As the company has high growth potential, the T Rowe Price Equity Income Fund (Trades, Portfolio) increased its Southwest Airlines position by 10.33% during the third quarter. With this transaction, the fund owns 1.7 million shares of Southwest, the fourth largest stake among gurus who own Southwest.
Peter Lynch identifies multiple "undervalued growth" airlines
The "Lynch Growth Airlines" Screener identifies the airlines that meet the following criteria:
The company's P/E (ttm) is between 1 and 14.
The company's return on capital is at least 20%.
The company's five-year revenue growth rate and 10-year revenue growth rate are 6% and 2%, respectively.
The company's trailing dividend yield is at least 0.90%.
Allegiant Travel Co. (ALGT), Alaska Air Group Inc. (ALK) and Southwest made the "Lynch Growth Airlines" screener.
The All-in-One Guru Screener contains two useful features: the Peter Lynch Charts and Backtesting. The former displays the Peter Lynch Chart for all stocks that meet all of the selected criteria in batches of three. As observed by the three charts, the three stocks listed above have generally traded below their Peter Lynch earnings line during the recent three years. Based on the screener results, these three airlines are good Peter Lynch buys.
During the backtesting period from September 2013 to September 2016, the "Lynch Growth Airlines" test portfolio invested in Alaska Air in September 2014 and all three airlines in September 2016. The following two tables summarize the test portfolio's performance relative to that of the Standard & Poor's 500 index exchange-traded fund.
Test Portfolio Performance | |
Year | Portfolio Return |
2014 | 28.96% |
2015 | 25.27% |
2016 | 11.70% |
Overall | 80.45% |
S&P 500 ETF Return | ||
Time Period | Backtesting Length | Overall Return |
2013-09 to 2016-09 | Three years | 30.69% |
2011-09 to 2016-09 | Five years | 76.84% |
2006-09 to 2016-09 | Ten years | 62.74% |
The Peter Lynch Screen displays undervalued companies based on one of four valuation ratios: the price-earnings ratio, the price-to-sales ratio, the price-to-book ratio or the price-to-EBITDA ratio. As of Oct. 26, Southwest is ranked No. 4 on the Peter Lynch P/E stock list.
You can view various valuation charts within the Peter Lynch Screen by clicking on the "Charts" tab. The gray ribbon containing various radio buttons allows you to select which charts to display. We offer the following charts within the Peter Lynch Screen:
Peter Lynch earnings line valuation
Median P/E valuation
Median P/S valuation
Median P/B valuation
Median P/EBITDA valuation
Historical dividend yield
Historical P/E
Historical P/S
Historical P/B
Premium members have access to all value screeners, including the Peter Lynch Screen and the All-in-One Guru Screener. The premium membership also includes access to over 150 gurus' portfolios and real-time picks. You can view the guru picks within an industry via Sector Picks.
For more information on the various member benefits, please view the membership levels page. The Premium Plus membership, our "ultimate package," includes access to advanced features including backtesting, the Excel Add-in and the API. If you are not a GuruFocus member, we invite you to a free seven-day trial. We also invite our Premium members to a free seven-day trial of Premium Plus.
Disclosure: The author has no position in any stock mentioned in this article.
This article first appeared on GuruFocus.
Warning! GuruFocus has detected 1 Warning Sign with LUV. Click here to check it out.
The intrinsic value of LUV
