S&P 500 FUTURES: THE STATS AND THE STARS
The bears come in, the bears go out, but not the bulls. The bulls just sit pat.
One of the things we as traders must be able to do is say we were wrong. Early last week we thought the ES could pull back and it didn't. The trend and the Fed are your friends and don't forget it!
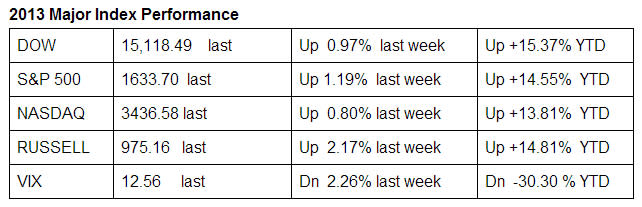
Last Friday stocks ended higher for the third week in a row, with the Dow and S&P closing at new record highs. This week is the April expiration. Below is a look at where the major indexes are year-to-date, a link to the Ned Davis S&P cash study that includes all the indices, and the Bradley Model vs Sell in May and Walk Away.
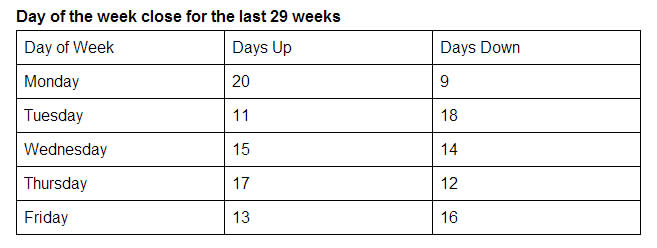
The reason we put up the performance table is to remind everyone how much the S&P is up. The reason we put up the Ned Davis stats is to show you that the Friday of the May expiration has been down 16 out of the last 29 occasions. The last part is about Donald Bradley’s Siderograph, a popular indicator that helps provide trend indication and turning points in the markets.
April S&P Expiration Stats
Ned Davis S&P cash study for the May expiration
Monday - up 20 / down 9 of the last 29 occasions
Tuesday - up 11 / down 18 of the last 29 occasions
Wednesday - up 15 / down 14 of the last 29 occasions
Thursday - up 17 / down 12 of the last 29 occasions
Friday - up 13 / down 16 of the last 29 occasion
https://mr-topstep.com/index.php/equities/2702-expiration-study-for-may
Bradley Model vs. Sell In May and Walk Away
Selling in May and walking away has been a big part of our trading tool box for the last 25 years. As stocks move from from their best six months (November to April) to their worst six months (May to October), we just cannot remember a time that the S&P was up almost 15% in the first 4-1/2 months of the new year. After the 60+ handle selloff in April and with the Fed printing presses working overtime, we think a selloff in May is unlikely. So we are turning to the Bradley Model, which over the years has called many “turning points.”
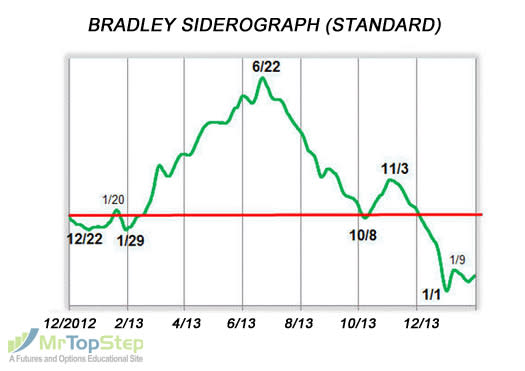
Will they walk away in May? We still have 15 trading days left in the month to figure that out. As MrTopStep has said for the last few weeks, we do not think they will. We think it will more likely happen in the summer or even in the fall, but we always keep an eye on the Bradley Model. If you want to learn more about this fascinating planetary-based indicator, go right to the source and get a copy of “Stock Market Prediction” by Donald Bradley, published in 1948, or just Google it up. No one knows for sure when the S&P is going to reverse, but what we do know is it can’t keep going up like it is forever.
Our view: There have been a total of 16 Mondays this year, 8 up / 7 down, 1 unchanged. The average daily gain is +7.9 handles and the average daily loss is 13.7 handles. This morning we have the retail sales and business inventories numbers. Asia closed mostly lower and Europe is trading lower. Friday gold was down almost $50.00 and closed down $14.50, crude was down $3.50 and closed down 60 cents. Let’s face it, this is Star Wars, and if you get on the wrong side you're dead. This morning the S&P is down 5. Ideally we still think the S&P is in need of a pullback, but the internal statistics and individual stock performance continues to be very strong. As always, keep an eye on the 10-handle rule and please use stops when trading futures.
It’s 7:15 a.m. and the ESM is trading 1624.75, down 4.75 handles; crude is down 40 cents at 95.64; and the euro is down 11 pips at 1.2975.
In Asia, 6 out of 11 markets closed lower (Shanghai Comp -0.22%, Hang Seng -1.42%, Nikkei +1.20%).
In Europe, 9 out of 12 markets are trading lower (CAC -0.22%, DAX -0.27%).
Today’s headline: “Dollar Up, Gold, Oil and S&P Down”
Total volume: 1.64mil ESM and 8.5k SPM traded
Economic calendar: Retail sales, business inventories
Fair value: S&P -3.65, NASDAQ -5.92
MrTopStep Closing Print Video: https://mr-topstep.com/index.php/multimedia/video/latest/closing-print-5-10-2013
Danny Riley is a 34-year veteran of the trading floor. He has helped run one of the largest S&P desks on the floor of the CME Group since 1985.
_____________________________________________________
Follow us on Twitter @MrTopStep http://twitter.com/mrtopstep
Sign up for our free mailing list at http://mrtopstep.com/ for full report.
DISCLAIMER: The information and data in the above report were obtained from sources considered reliable. Opinions, market data, and recommendations are subject to change at any time. Their accuracy or completeness is not guaranteed and the giving of the same is not to be deemed as an offer or solicitation on our part with respect to the sale or purchase of any commodities or securities.
{jathumbnailoff}

