Oil Price Supported by Volatile Dollar, Gold Price at 1-Week High
DailyFX.com -
Talking Points:
Crude Oil Price: consolidation favors bullish continuation > $49.17/bbl
Gold Price: one week high on volatile USD, weekly chart encouraging
Saudi has begun selling 5-, 10- & 30- year bonds, which shows confidence in Oil market
Crude Oil continues to oscillate around $50/bbl on Tuesday. The worry about whether or not the OPEC accord will hold at the November meeting in Vienna remain. A key point that encouraged markets on Tuesday though the short-term price action did not appear to reflect the news was the announcement that Saudi Arabia would follow Qatar’s lead in selling government bonds internationally. The debut of international bonds is understandably designed to help fund the budget deficit due to the collapse in Oil prices but also will help be a proxy for the health of the Oil market. The Dollar-denominated bonds are aimed to sell at a premium to U.S. Treasuries of 160bps.
Interested In Our Best Views For Q4 Volatility? Access Our Analysts Views On Key Markets Here
Gold prices are benefitting from a weaker-USD after core-CPI missed on Tuesday morning. In addition to weaker US-Data, which will pour cold water on the U.S. rate outlook past the anticipated December hike, good news came from China last night that benefited base metals and precious metals alike. Overnight, a surging of new credit data from China helped show that demand could find support, and begin to rise. Lastly, at the Singapore meeting of the London Bullion Market Association, a survey of people attending anticipate Gold to increase by ~7%, and for silver to gain ~18% according to Bloomberg. Much of this demand is expected to come from low or negative rates and economic worries persisting.
GOLD TECHNICAL ANALYSIS –The price of Gold remains under resistance of the 200-DMA at $1,264.77/oz. We noted yesterday that on the Daily chart, there was an encouragement for the Bulls that the slope of the 200-DMA is positive. However, until the price of Gold closes above the 200-DMA, it will remain too early to say whether or not the drop from September 21 in the price of Gold by $100/oz is over. Another point worth mentioning comes from the Weekly Chart, which is showing the current 3-month and 10% drawdown as a possible predecessor to the next leg higher.
You can see the move from December has been the breakout from a long-term wedge pattern. The excited also comes from price consolidation above the Ichimoku Cloud, a long-term trend indicator. When looking at Ichimoku, Price & Momentum (candles & bright green line) above the cloud indicate a strong uptrend that is anticipated to resume. As we’ve shared before, we still would be cautious in the short-term as we trade below the 200-DMA, but the medium-term outlook continues to look favorable for further upside.
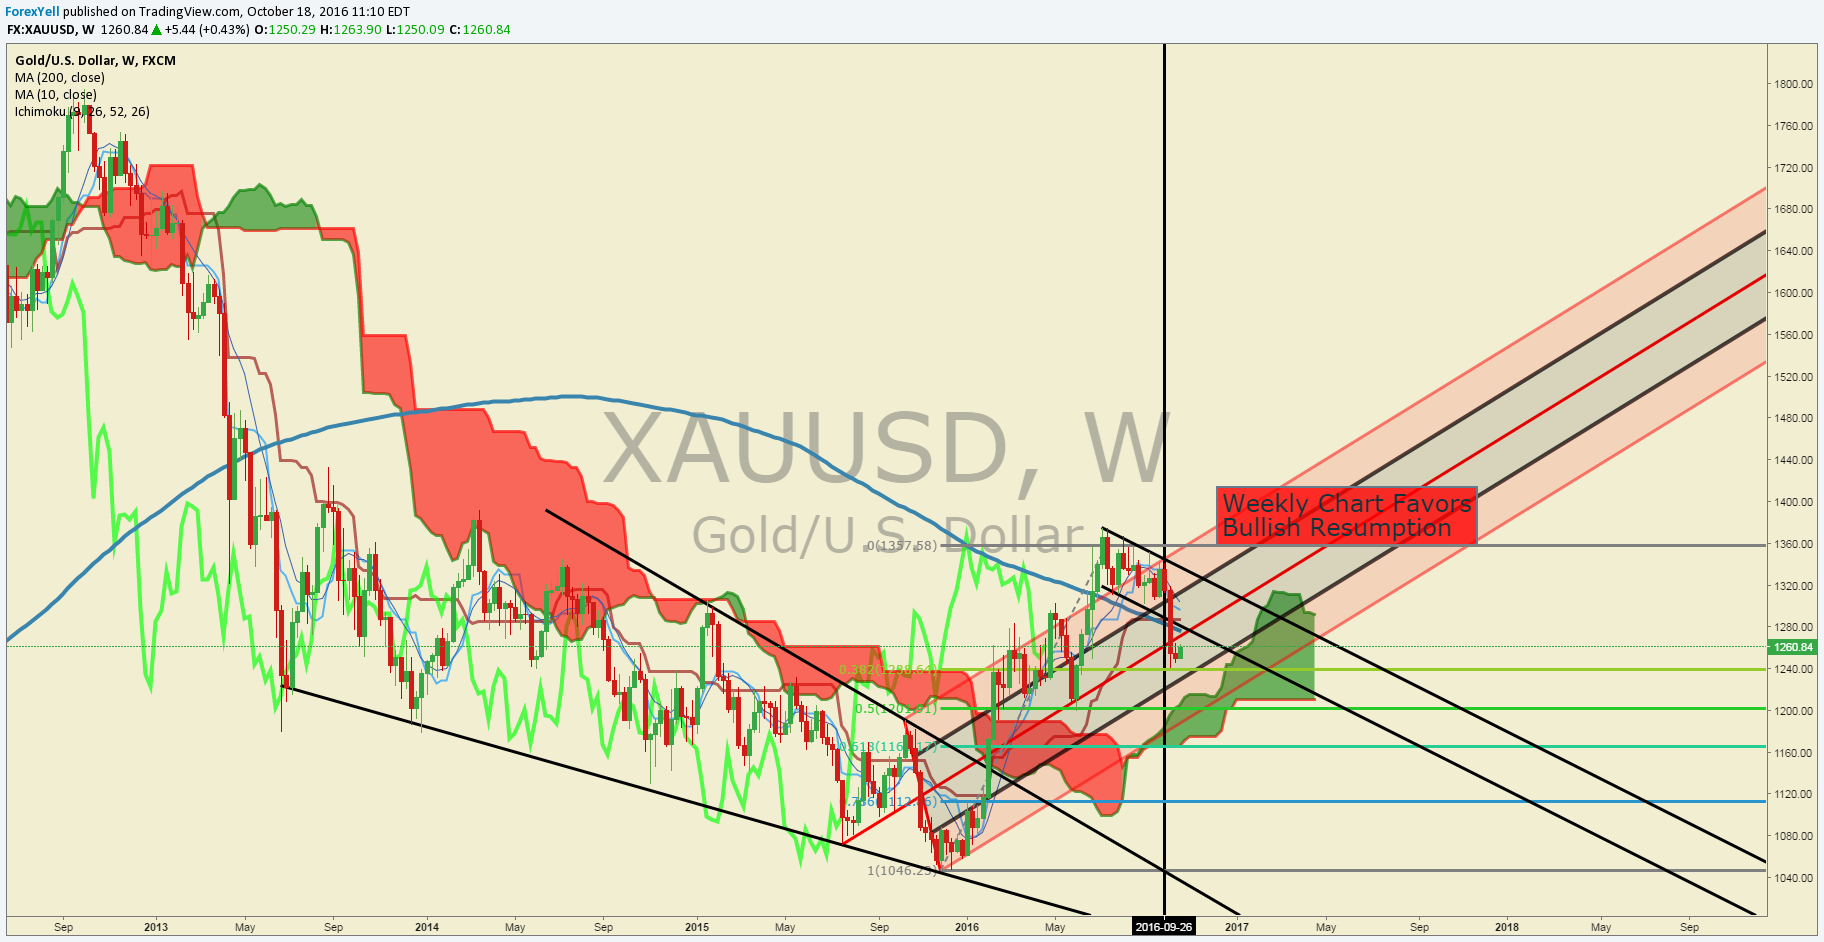
Chart Created by Tyler Yell, CMT. Courtesy of TradingView
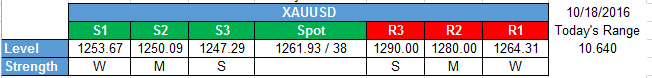
Short-Term Gold Price Support & Resistance Levels:
CRUDE OIL TECHNICAL ANALYSIS – Medium-term Crude traders continue to keep an eye on the ~$52/bbl level that would initiate the Bullish Head & Shoulder’s pattern that would target the upper $70/bbl range. Shorter-term traders are naturally keeping an eye on the sideways consolidation that has weathered recent USD strength well.
The shorter-term chart below is an H4 chart with Ichimoku Cloud applied and a horizontal line drawn at ~$51/bbl. A break above $51/bbl after bouncing off the cloud would should that we’re entering into a breakout phase that is hard to fight. In the last note, we shared how the 50-DMA crossed above the 100-DMA, which also occurred in April when Crude rallied ~20% before reaching the June 9 high that we’re currently targeting at $51.64/bbl. Naturally, this doesn’t necessarily imply a moon shot, but it does make sense why institutional investors are exiting their short crude positions rather aggressively.
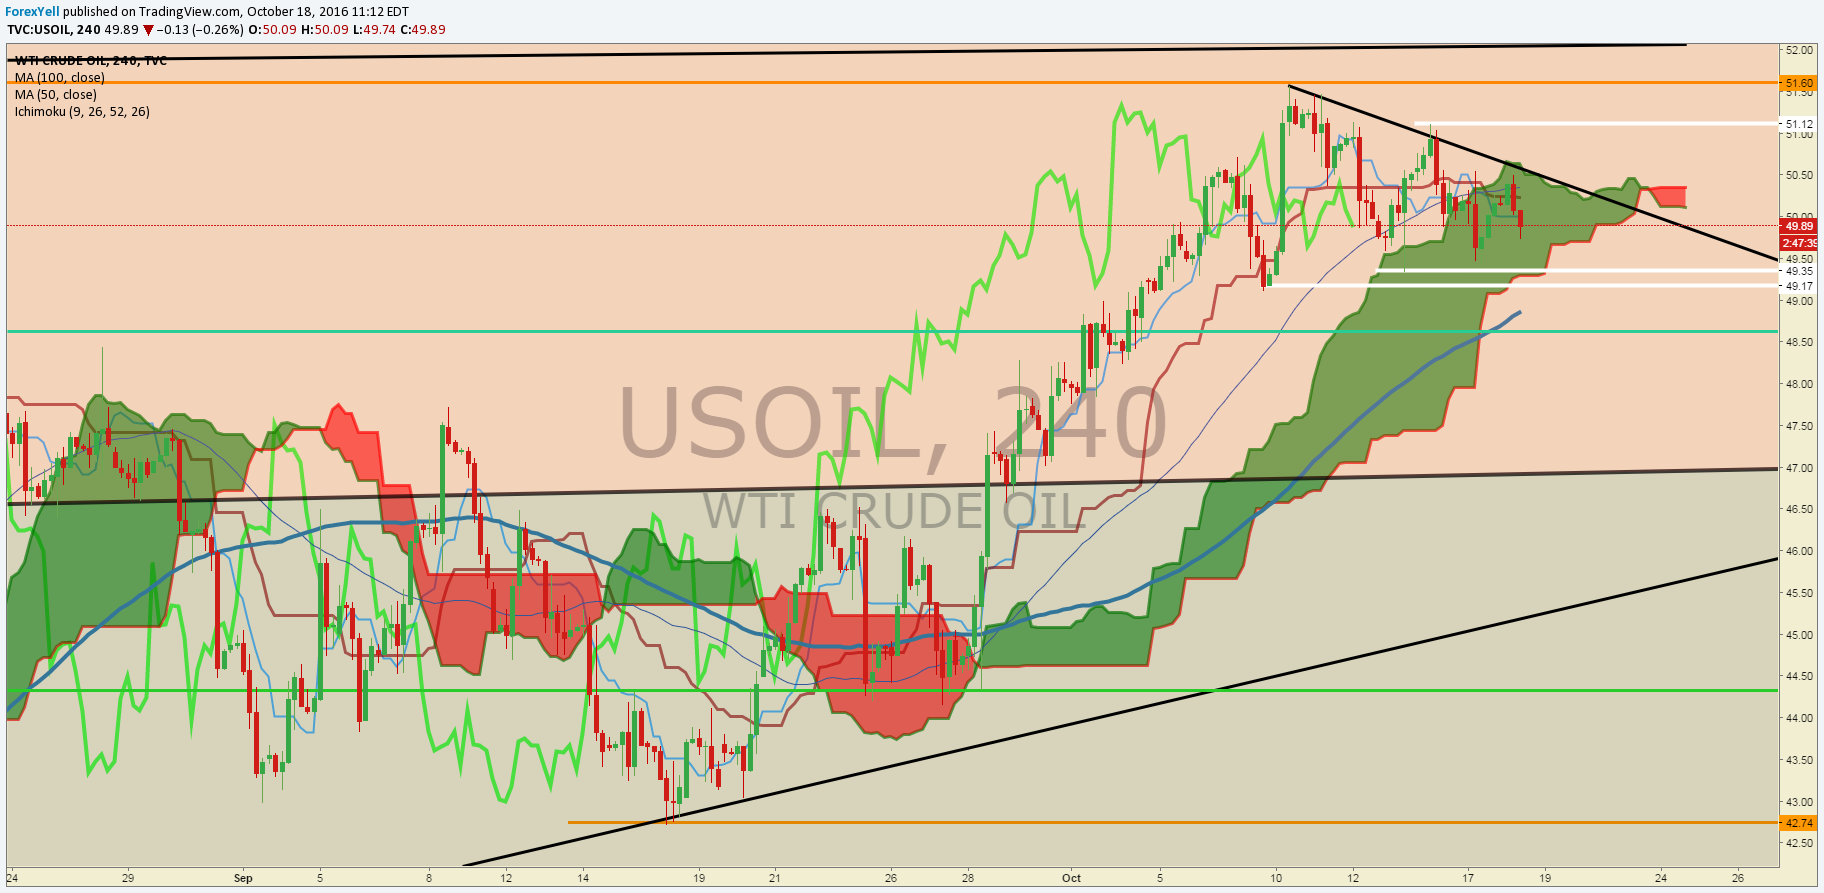
Chart Created by Tyler Yell, CMT. Courtesy of TradingView
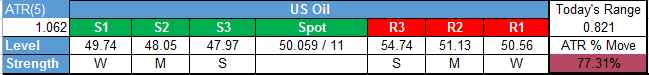
Short-Term Crude Oil Price Support & Resistance Levels:
--- Written by Tyler Yell, CMT Currency Analyst for DailyFX.com
To receive Tyler’s analysis directly via email, please SIGN UP HERE
Contact and follow Ilya on Twitter: @ForexYell
DailyFX provides forex news and technical analysis on the trends that influence the global currency markets.
Learn forex trading with a free practice account and trading charts from FXCM.

