Who Are The Major Shareholders In Northern Oil and Gas Inc (NYSEMKT:NOG)?

If you want to know who really controls Northern Oil and Gas Inc (NYSEMKT:NOG), then you’ll have to look at the makeup of its share registry. Insiders often own a large chunk of younger, smaller, companies while huge companies tend to have institutions as shareholders. Warren Buffett said that he likes ‘a business with enduring competitive advantages that is run by able and owner-oriented people’. So it’s nice to see some insider ownership, because it may suggest that management is owner-oriented.
With a market capitalization of US$1.18b, Northern Oil and Gas is a decent size, so it is probably on the radar of institutional investors. Taking a look at the our data on the ownership groups (below), it’s seems that institutional investors have bought into the company. Let’s take a closer look to see what the different types of shareholder can tell us about NOG.
See our latest analysis for Northern Oil and Gas
What Does The Institutional Ownership Tell Us About Northern Oil and Gas?
Many institutions measure their performance against an index that approximates the local market. So they usually pay more attention to companies that are included in major indices.
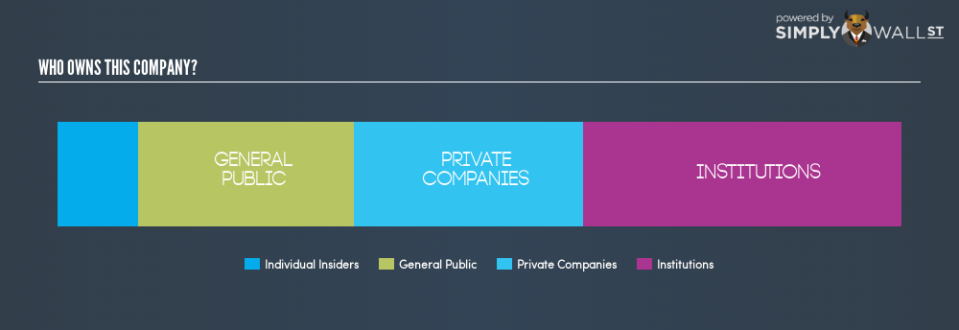
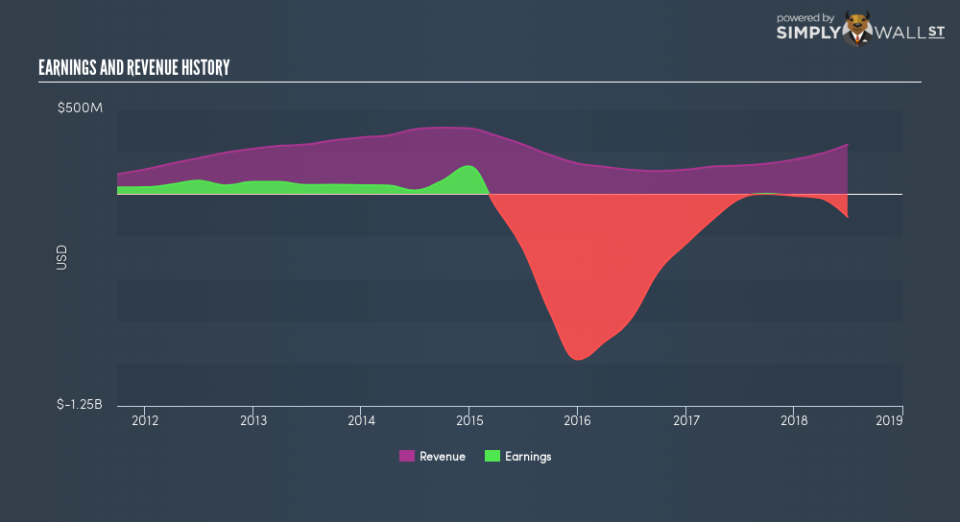
Northern Oil and Gas already has institutions on the share registry. Indeed, they own 37.6% of the company. This implies the analysts working for those institutions have looked at the stock and they like it. But just like anyone else, they could be wrong. When multiple institutions own a stock, there’s always a risk that they are in a ‘crowded trade’. When such a trade goes wrong, multiple parties may compete to sell stock fast. This risk is higher in a company without a history of growth. You can see Northern Oil and Gas’s historic earnings and revenue, below, but keep in mind there’s always more to the story.
Northern Oil and Gas is not owned by hedge funds. Quite a few analysts cover the stock, so you could look into forecast growth quite easily.
Insider Ownership Of Northern Oil and Gas
The definition of company insiders can be subjective, and does vary between jurisdictions. Our data reflects individual insiders, capturing board members at the very least. The company management answer to the board; and the latter should represent the interests of shareholders. Notably, sometimes top-level managers are on the board, themselves.
I generally consider insider ownership to be a good thing. However, on some occasions it makes it more difficult for other shareholders to hold the board accountable for decisions.
Our most recent data indicates that insiders own some shares in Northern Oil and Gas Inc. This is a big company, so it is good to see this level of alignment. Insiders own US$113.8m worth of shares (at current prices). It is good to see this level of investment by insiders. You can check here to see if those insiders have been buying recently.
General Public Ownership
The general public holds a 25.6% stake in NOG. While this size of ownership may not be enough to sway a policy decision in their favour, they can still make a collective impact on company policies.
Private Company Ownership
It seems that Private Companies own 27.2%, of the NOG stock. It’s hard to draw any conclusions from this fact alone, so its worth looking into who owns those private companies. Sometimes insiders or other related parties have an interest in shares in a public company through a separate private company.
Next Steps:
While it is well worth considering the different groups that own a company, there are other factors that are even more important.
I like to dive deeper into how a company has performed in the past. You can find historic revenue and earnings in this detailed graph.
Ultimately the future is most important. You can access this free report on analyst forecasts for the company.
NB: Figures in this article are calculated using data from the last twelve months, which refer to the 12-month period ending on the last date of the month the financial statement is dated. This may not be consistent with full year annual report figures.
To help readers see past the short term volatility of the financial market, we aim to bring you a long-term focused research analysis purely driven by fundamental data. Note that our analysis does not factor in the latest price-sensitive company announcements.
The author is an independent contributor and at the time of publication had no position in the stocks mentioned. For errors that warrant correction please contact the editor at editorial-team@simplywallst.com.
