List of cities selected to take part in annual heat mapping project

WASHINGTON – NOAA, in collaboration with several partners, will embark on a mission to map out some of the hottest cities this summer in an effort to identify urban heat islands.
Volunteers in 14 U.S. communities and four international cities are participating in the summer survey.
Every year, more Americans die from extreme heat than any other weather event, and the multi-agency campaign will work to identify which communities are at most risk of seeing the scorching temperatures.
This year’s endeavor will seek volunteers in 14 U.S. communities, including Bloomington, Indiana; Calexico, California; Charlotte, North Carolina; Flint, Michigan; Fort Wayne, Indiana; Grand Junction, Colorado; Hennepin and Ramsey Counties, Minnesota; Laredo, Texas; Pierce County, Washington; Reno and Sparks, Nevada; Santa Fe, New Mexico; and Unincorporated Norcross, Georgia.
International campaigns will take place in Mexicali, Mexico; Dhaka, Bangladesh; Nairobi, Kenya; and Salvador, Brazil.
"This mapping campaign is an important step to understand how extreme heat affects the health, safety, and quality of life of our communities," Acting HUD Secretary Adrianne Todman said in a statement.
HEAT MAPPING CAMPAIGN HOPES TO SPREAD AWARENESS ABOUT COUNTRY’S TOP WEATHER-RELATED KILLER
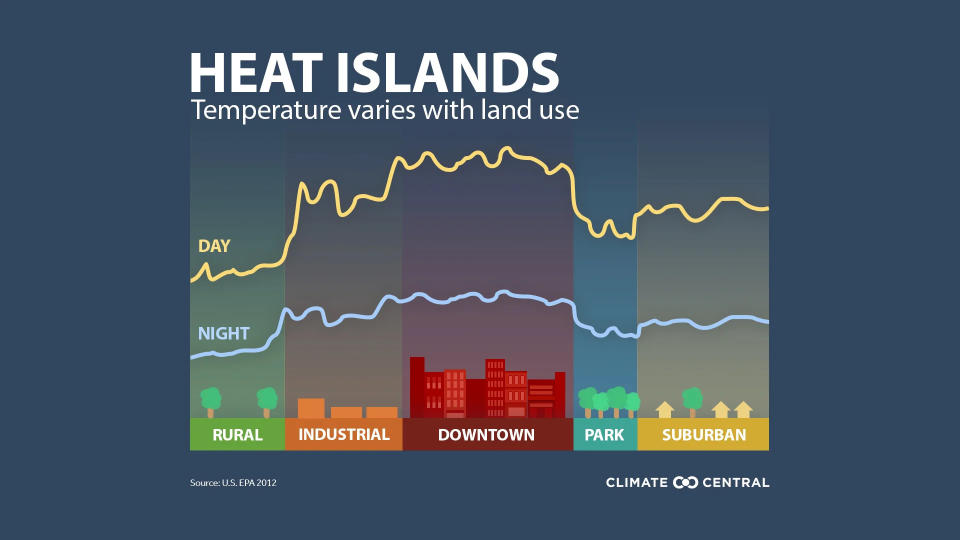
NOAA’s Urban Heat Island mapping campaign is in its eighth year, and according to the agency, a lack of vegetation and extensive pavement can cause neighborhoods to be upwards of 20 degrees warmer than nearby areas.
Participating volunteers are given devices that easily attach to a vehicle or a bike which take humidity and temperature readings and store the observations.
The low-tech method of determining how temperatures vary throughout a city is considered by experts to be more effective in identifying the urban heat island effect than data from satellites and other sensory methods.
NOAA said previous campaigns have led to increased funding for tree planting initiatives, the establishment of cooling centers during heat waves and other extreme weather action plans.
Results from the latest heat mapping campaign are expected to be released later this year.
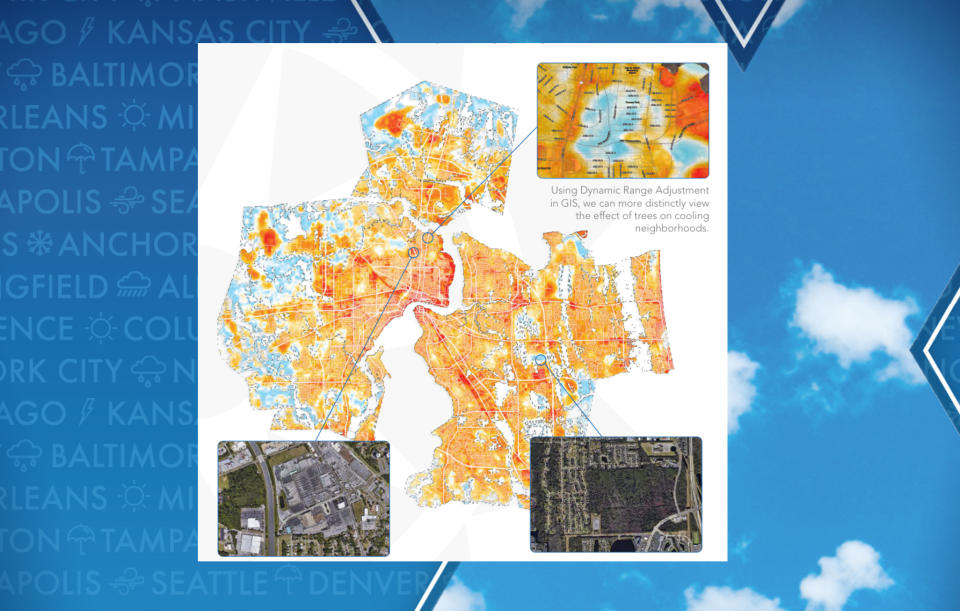
In 2022, Jacksonville, Florida, was one of more than a dozen cities that took part in the survey.
Volunteers drove over 400 miles in Duval County and determined there was a 12-degree temperature spread between neighborhoods.
City leaders said the results helped them determine where to increase tree density as well as determine where building codes needed to be enhanced.
Original article source: List of cities selected to take part in annual heat mapping project

