Lack of Awareness Of “Teachers as the Cause of Non-Attendance” ― Considered from the Gap between School Survey and Student Survey
Ryo Uchida | Ph.D, Nagoya University
The original Japanese article was published on 11:11 October 16, 2016

Non-attendance caused by relationship with teachers – There is a 16 times difference in the responses by schools and students
Cause of non-attendance; No survey conducted to the student him/herself?!
It will be the 50th year for the Ministry of Education, Culture, Sports, Science and Technology (MEXT) to disclose the “Survey on Problems Related to Student Guidance, Such as Problematic Behaviors of School Children and Students” in which the current state of bullying, violence, non-attendance, suicides, etc. is summarized. The results are usually announced in the fall of each year and the results for FY2015 should be announced soon.

Webpage on “Survey on Problems Related to Student Guidance, Such as Problematic Behaviors of School Children and Students”
This survey originally started as a survey on “non-attendance” in FY1966 (in those days it was called “school phobia”). “Non-attendance” is a state in which the student is absent from school or cannot attend school for more than 30 days a year, for reasons other than sickness and economic circumstances. In elementary schools and junior high schools in Japan, approximately 120 thousand children are in a state of non-attendance. In Japan, “non-attendance” is one of the largest educational issues along with “bullying”.
There is one thing that concerns me in this survey on “non-attendance” which has been conducted for such a long time. In addition to basic figures such as the number of non-attending school children/students by elementary/junior high schools and by public/private schools and by grade, the survey makes in-depth analysis on the actual situations, such as reason why each of the school children/students became unable to attend schools and why they continue not to attend.
However, when I asked the persons who have the experience of not being able to attend schools, they answered that they have “never been asked the reason for not attending school for a survey.” No surveys are made, yet the figures are disclosed. How is this possible? And how much of the disclosed figure is consistent with the awareness of the persons who have not been able to attend schools?
Discomfort felt by those who were unable to attend schools

Image: ASHINARI
To start with some of the conclusions first, ” Survey on Problems Related to Student Guidance, Such as Problematic Behaviors of School Children and Students” is answered by schools. Therefore, the causes of non-attendance listed there are those that were merely judged by the schools and there is a possibility that they do not coincide with the feelings of the students.
The reason why I became interested in this was triggered by the questions raised by Mr. Shikou Ishii (editor of “Futoko Shimbun (Non-Attendance Newspaper)”) who himself was unable to attend school. “Futoko Shimbun” is a newspaper published by an NPO that specially handles non-attendance and hikikomori (social recluse). Mr. Ishii says that he felt discomfort in the fact that, ” Survey on Problems Related to Student Guidance, Such as Problematic Behaviors of School Children and Students” was conducted and that the causes of non-attendance were discussed, without reflecting the views of the persons who were non-attending. He also questioned the especially low proportion of schools citing the relationship with teachers as the “cause of non-attendance”.
There is actually a research that directly surveyed persons who were unable to attend schools (Note 1). In this research, follow-up surveys were conducted on students who were non-attending in junior high schools and inquiries were made on the situations during and after non-attendance. The result has been disclosed in July 2014 as ”2006 Report on the Follow-Up Survey on Non-Attending Students” (Japanese only). Here, the result of the responses on the causes of non-attendance is disclosed.
■There is more than one reason why we were unable to attend school
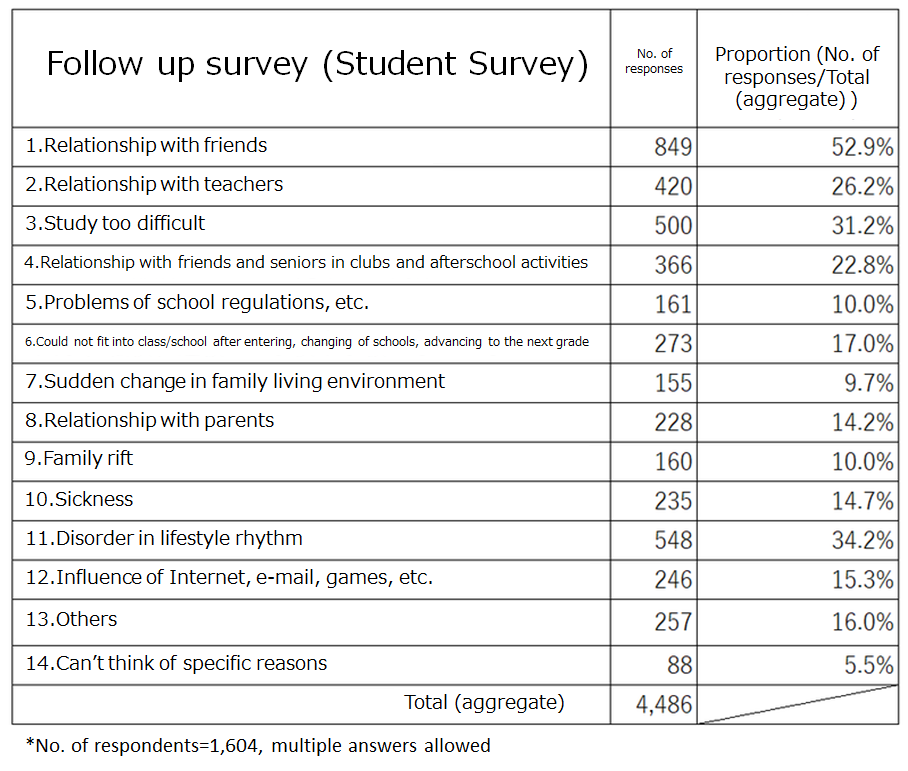
Causes of non-attendance: Survey of persons who were unable to attend school

Causes of non-attendance: Survey of schools
How does the “Survey on Problems Related to Student Guidance, Such as Problematic Behaviors of School Children and Students” responded by schools (hereafter, ”School Survey”) differ from the follow-up survey responded by persons who were unable to attend school (hereafter, “Student Survey”)?
In the Student Survey, students who were in the 3rd grade of public junior high schools as of FY2006 and who were unable to attend school, responded to the questions. Therefore, comparison should be made with the data on public junior high schools from the School Survey as of FY2006(”2006 Survey on Problems Related to Student Guidance, Such as Problematic Behaviors of School Children and Students”)(Japanese only).
Strictly speaking, the respondents of the two surveys and the questions asked regarding the “causes of non-attendance” are not the same. However, in various aspects, the two data are fully comparable (Note 2). First, the overall impression to be noted is that in all of the 14 choices for the “causes of non-attendance”, Student Survey has a larger value than School Survey. This means that more students who were unable to attend school chose multiple answers as “causes of non-attendance” than schools.
In the Student Survey, 2.8 choices (4,486÷1,604) were chosen per student and in the School Survey, 1.2 choices (115,411÷99,959) were chosen per student as causes of non-attendance. Roughly speaking, within the 14 choices, the students have chosen about three causes for non-attendance, whereas schools have limited their answers to one cause.
From the viewpoint of the students, there are various factors and problems that lead to non-attendance. However, schools do not seem to comprehend non-attendance to stem from a number of factors.
Are teachers also the cause of non-attendance? Awareness gap
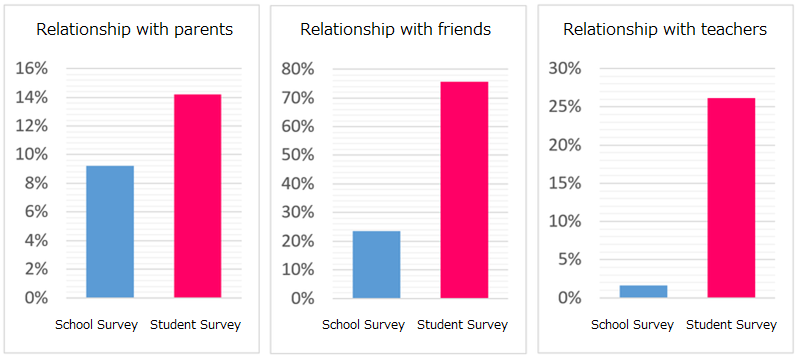
Awareness gap between the School Survey and the Student Survey
Human relationships with parents, friends, and teachers are included in the 14 choices for the “causes of non-attendance”. In both surveys, human relationship with friends has the highest figure among the choices related to human relationships (Note 3). This is not hard to imagine, but what I want to highlight in this article, is instead, the awareness gap between the schools and the students.
Please have a look at the graphs. First, let’s take a look at the proportions that regard “relationship with parents” to be the cause of non-attendance. In terms of those who think that parents have impact on non-attendance, there is not such a big gap between the School Survey and the Student Survey – the difference is only 1.5 times. Next, there is a 3.2 times difference in the answers that regard that “relationship with friends” is the cause of non-attendance.
Up till here, the gap between the schools and students can be regarded to be within whether multiple causes are chosen or not. As mentioned before, persons who were unable to attend schools tend to choose multiple causes (in the Student Survey 2.8 causes, and 1.2 causes in the School Survey per student), thus in any of the causes there will be 2 to 3 times difference between the two surveys.
Image: ASHINARI
However, the “relationship with teachers” as cause of non-attendance is beyond this scope. In the School Survey, teachers as the cause of non-attendance constitute only 1.6% (smallest in all of the causes in the School Survey). In the Student Survey, however, this figure surges to 26.2%. There is a 16.3 times difference between the schools and students. This means that even if the students feel that the “teachers are to blame” for non-attendance, the schools do not think of it in such a way at all.
I am not writing this to say that “teachers are to blame for non-attendance.” What is important is to be aware of the awareness gap. If the students and schools visualize completely different “causes for non-attendance”, it would not be possible to hold even a dialogue.
Earnestly picking up children’s voices – this is a task that is imposed on schools, educational administrations and all of us adults.
[Additional remark]
Part of the result of the analysis conducted as a result of the questions raised by Mr. Shikou Ishii has already been responded to Mr. Ishii. Based on the response, an article has been issued in the “Futoko Shimbun”.(10/15 “Futoko Shimbun” No. 444)(Japanese only) The handling of the figures is slightly different from this article in some specific points. However, basically, similar results are shown.
[Note 1]Survey conducted by the ”Follow-Up Survey Research Team on Non-Attending Students” established within the MEXT. Mr. Yoji Morita (Specially Appointed Professor of Naruto University of Education), who has led the Japanese educational circle through his research on bullying and non-attendance, presided the research team.
[Note 2]All of the students who were unable to attend school are noted in the “Survey on Problems Related to Student Guidance, Such as Problematic Behaviors of School Children and Students”. Meanwhile, the students noted in the follow-up survey are those who “agreed to cooperate with the survey” in 2011 (the survey was conducted in 2012) within the students who were in the 3rd grade of junior high schools unable to attend school as of FY2006. As for the causes of non-attendance, both surveys list up 14 choices and the choices have many similarities. In particular, relationships with parents/friends/teachers to which this article focuses, had many similarities in their questions, thus the two surveys were compared.
[Note 3]The figure for “Relationship with friends” is: the total of “Bullying” and “Relationship with friends excluding bullying” in the School Survey; and the total of “Relationship with friends” and “Relationship with friends and seniors in clubs and afterschool activities” in the Student Survey. In addition, for the figure for “Relationship with parents”, reference was made to: “Problems related to parent-child relationship” for the School Survey; and “Relationship with parents” for the Student Survey. For the figure for “Relationship with teachers”, reference was made to: “Problems related to relationship with teachers/staff” for the School Survey; and “Relationship with teachers” for the Student Survey.

