How are Kentucky’s school districts performing? Try this easy-to-use tool to find out
For many busy parents, it can be tough to get a grasp on how schools in their area are doing, let alone their own children.
In fact, research has shown the vast majority of K-12 parents overestimate their children’s performance, even when standardized test scores generally show the opposite.
For a lot of parents, it’s difficult to even know where to begin, and that’s much of the driving force behind a set of new school district profiles from the Prichard Committee for Academic Excellence.
The set of profiles, which covers every public school district in Kentucky, offers a quick look at learning progress from preschool to post-secondary and how school districts are performing on key education measures compared to the state as a whole.
From 2018 to 2024, each profile outlines where a given school district stands on kindergarten readiness, reading and math proficiency for third- and eighth-grade students, graduation rate and its college-going and degree-attainment rates, among other measures. The data points are presented in infographics with context about how results have changed in recent years and how students from different backgrounds are doing.
“The goal with the Groundswell Community Profiles is to get data for early childhood and early post-secondary into the hands of community members so that they better understand the outcomes in education …. early childhood and early post-secondary in their community,” Brigitte Blom, the Prichard Committee’s president and CEO, told the Herald-Leader in a recent interview.
The effort goes beyond simply offering parents another way to rank schools or put them into the limiting “good” or “bad” school box. Parents and other community members are meant to look at how their school district is doing and ask what they can do to help, Blom said. Whether that starts with moms in a coffee shop brainstorming ways to improve local kindergarten readiness or a rotary club that wants to fund college scholarships, “this profile should be an eye-opener for them,” Blom said.
The school district profiles are part of a broader effort by the Prichard Committee to establish “community schools,” or schools that remove barriers to learning with evidence-based practices. The Groundswell project is being funded by a five-year grant from the federal Department of Education, which the Prichard Committee announced last year.
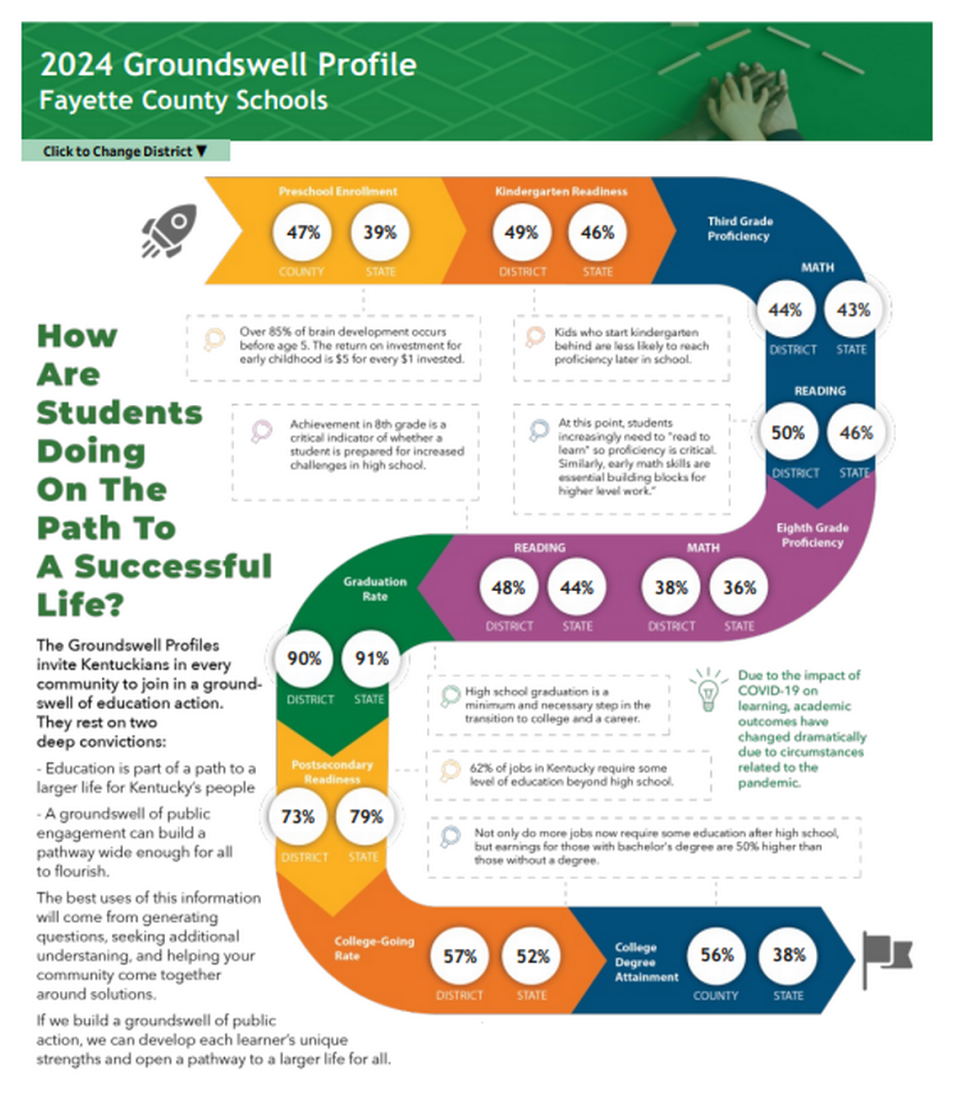
How are Fayette County schools doing?
The profile for Fayette County indicates schools here are generally performing above the state average on key measures such as kindergarten readiness and reading and math proficiency for third- and eighth-grade students. That said, there is still room for improvement on those measures.
For example, 50% of the district’s third-grade students were proficient in reading, according to the latest profile for Fayette County. Experts note that’s the point at which students generally begin reading to learn, rather than learning to read.
It isn’t just post-pandemic learning loss
Last year, a Herald-Leader analysis of spring test score data showed only about a quarter of all Kentucky schools had more than half of their students test proficient or distinguished in math.
While the state did see some improvement in reading scores at the elementary level, the gains were smaller at middle and high schools.
Overall, Kentucky’s elementary, middle and high schools got a yellow rating, the third-highest grade in the state’s color-coded school accountability system.
Asked to put the results into context, Robin Fields Kinney, the state’s interim education commissioner at the time, looked at the lingering fallout from the coronavirus pandemic.
“We must not underestimate how much of an impact the COVID-19 pandemic has had on our children,” Kinney said. “We know that changes in the way instruction was delivered from 2020 to 2022 had an impact on student learning, despite the tremendous efforts of Kentucky educators and parents to remediate those impacts.”
While that learning loss shouldn’t be ignored, it doesn’t fully explain the decline seen in key education measures, which as Blom noted, have been on the downturn since 2015.
“It’s important to note that while we can clearly look at the Groundswell Community Profiles and see it drop since COVID, the drop we were seeing statewide was actually happening well before COVID,” Blom said. “We’ve been seeing declines in education outcomes since 2015 statewide. One of the best indicators of that is Kentucky ranking eighth in the nation in fourth-grade reading in 2015. And today we ranked 29th … That’s not the result of the pandemic, those declines we were starting to see well before the pandemic.”
As we said a couple months ago - as long as Kentucky's early childhood system remains fragile, so will Kentucky's economy. #BigBoldFuture
We're coming with a plan, #KYGA23. #BigBoldAsk #StrongStartKY Thanks, @KYLantern for great coverage. @JamieLucke https://t.co/xHwWmnFZu0— Brigitte M. Blom (@Brigitte_Blom) November 30, 2022
Giving parents and communities an easy-to-follow entry point to understand the basic challenges their schools are facing is the first step, Blom said.
“We’d like to see people take these profiles and do something with what they’ve learned in their area of interest,” Blom said.
You can dig into each school district’s Groundswell Community Profile at prichardcommittee.org/2024profiles.
Do you have a question about education in Kentucky for our service journalism team? We want to hear from you. Send your questions, comments and story ideas to ask@herald-leader.com or connect with us by using the Know Your Kentucky form below.

