JPMorgan Chase Is Significantly Undervalued
- By Benjamin Clark
Benjamin Graham taught that Intelligent Investors must do a thorough fundamental analysis of investment opportunities to determine their intrinsic values and inherent risks.
This is best done by utilizing a systematic approach to analysis that will provide investors with a sense of how a specific company compares to another company or by reviewing the 10 Companies Benjamin Graham Would Invest In Today - July 2016. By using the ModernGraham method one can review a company's historical accomplishments and determine an intrinsic value that can be compared across industries. What follows is a stock analysis showing a specific look at how JPMorgan Chase & Co. (JPM) fares in the ModernGraham valuation model.
Warning! GuruFocus has detected 6 Warning Signs with ADP. Click here to check it out.
The intrinsic value of JPM
Downloadable PDF version of this valuation: ModernGraham Valuation of JPM - July 2016
Stage 1: Is this company suitable for the Defensive Investor or the Enterprising Investor?
What kind of Intelligent Investor are you?
Defensive Investor; must pass all six of the following tests. | ||||
1. Adequate Size of the Enterprise | Market Cap > $2 billion. | $235,459,266,895 | Pass | |
2. Earnings Stability | Positive EPS for 10 years prior. | Pass | ||
3. Dividend Record | Dividend Payments for 10 years prior. | Pass | ||
4. Earnings Growth | Increase of 33% in EPS in past 10 years using 3 year averages at beginning and end. | 108.99% | Pass | |
5. Moderate PEmg Ratio | PEmg < 20. | 11.86 | Pass | |
6. Moderate Price to Assets | PB Ratio < 2.5 OR PB*PEmg < 50. | 0.93 | Pass | |
Enterprising Investor; must pass all three of the following tests, or be suitable for the Defensive Investor. | ||||
1. Earnings Stability | Positive EPS for five years prior. | Pass | ||
2. Dividend Record | Currently pays dividend. | Pass | ||
3. Earnings Growth | EPSmg greater than five years ago. | Pass | ||
Stage 2: Determination of intrinsic value
EPSmg | $5.40 |
MG Growth Estimate | 4.70% |
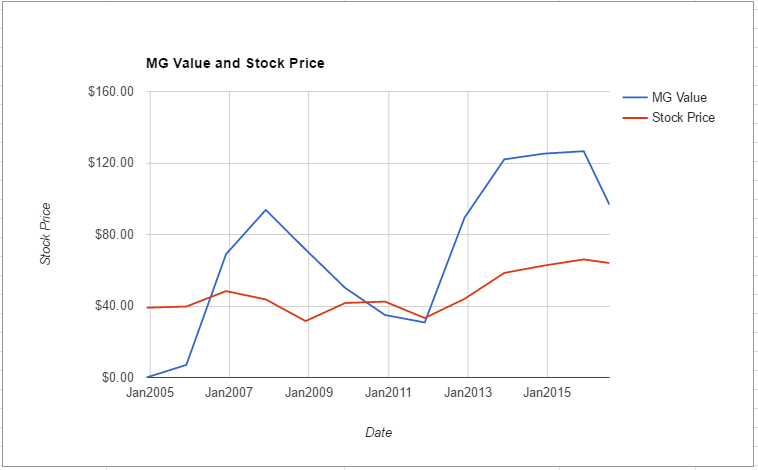
MG Value | $96.69 |
Opinion | Undervalued |
MG Grade | B+ |
MG Value based on 3% Growth | $78.32 |
MG Value based on 0% Growth | $45.91 |
Market Implied Growth Rate | 1.68% |
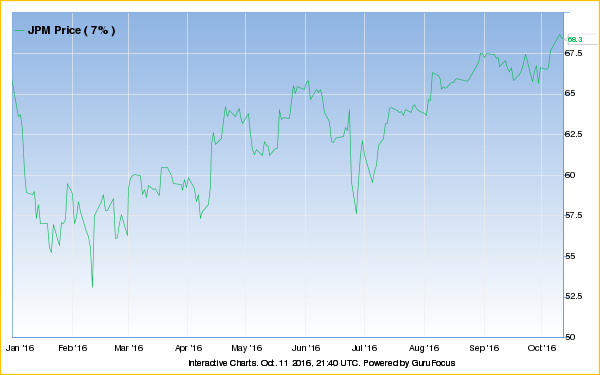
Current Price | $64.04 |
% of Intrinsic Value | 66.24% |
JPMorgan Chase qualifies for both the Defensive Investor and the Enterprising Investor. In fact, the company meets all of the requirements of both investor types, a rare accomplishment indicative of the company's strong financial position. The Enterprising Investor has no initial concerns. As a result, all value investors following the ModernGraham approach should feel comfortable proceeding with the analysis.
As for a valuation, the company appears to be undervalued after growing its EPSmg (normalized earnings) from $4.11 in 2012 to an estimated $5.4 for 2016. This level of demonstrated earnings growth outpaces the market's implied estimate of 1.68% annual earnings growth over the next seven to 10 years. As a result, the ModernGraham valuation model, based on Benjamin Graham's formula, returns an estimate of intrinsic value above the price.
JPMorgan Chase performs fairly well in the ModernGraham grading system, scoring a B+.
Stage 3: Information for further research
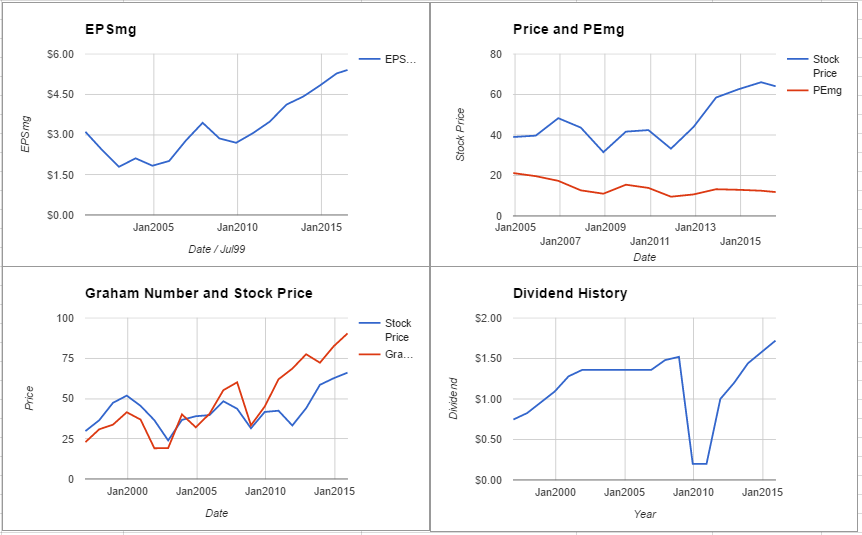
Graham Number | $87.12 |
PEmg | 11.86 |
PB Ratio | 0.93 |
Dividend Yield | 2.81% |
TTM Dividend | $1.80 |
Number of Consecutive Years of Dividend Growth | 6 |
Most recent balance sheet figures
Balance Sheet Information | 6/1/2016 |
Long-Term Debt | $315,572,000,000 |
Total Assets | $2,466,096,000,000 |
Intangible Assets | $53,292,000,000 |
Total Liabilities | $2,213,673,000,000 |
Shares Outstanding (Diluted Average) | 3,666,500,000 |
Earnings per share history
Next Fiscal Year Estimate | $5.45 |
Dec. 2015 | $6.00 |
Dec. 2014 | $5.29 |
Dec. 2013 | $4.35 |
Dec. 2012 | $5.20 |
Dec. 2011 | $4.48 |
Dec. 2010 | $3.96 |
Dec. 2009 | $2.26 |
Dec. 2008 | $1.37 |
Dec. 2007 | $4.38 |
Dec. 2006 | $4.04 |
Dec. 2005 | $2.38 |
Dec. 2004 | $1.55 |
Dec. 2003 | $3.24 |
Dec. 2002 | $0.80 |
Dec. 2001 | $0.80 |
Dec. 2000 | $2.86 |
Dec. 1999 | $4.18 |
Dec. 1998 | $2.83 |
Dec. 1997 | $2.68 |
Dec. 1996 | $1.65 |
Earnings per share - ModernGraham (normalized EPS) history
Next Fiscal Year Estimate | $5.40 |
Dec. 2015 | $5.27 |
Dec. 2014 | $4.82 |
Dec. 2013 | $4.41 |
Dec. 2012 | $4.11 |
Dec. 2011 | $3.48 |
Dec. 2010 | $3.05 |
Dec. 2009 | $2.69 |
Dec. 2008 | $2.85 |
Dec. 2007 | $3.44 |
Dec. 2006 | $2.78 |
Dec. 2005 | $2.01 |
Dec. 2004 | $1.84 |
Dec. 2003 | $2.11 |
Dec. 2002 | $1.80 |
Dec. 2001 | $2.42 |
Dec. 2000 | $3.10 |
Recommended reading:
Other ModernGraham posts about the company
10 Low PE Stocks for the Defensive Investor - July 2016 | |
5 Undervalued Dow Components to Research - July 2016 | |
10 Low PE Stocks for the Defensive Investor - June 2016 | |
10 Low PE Stocks for the Defensive Investor - May 2016 | |
18 Best Stocks For Value Investors This Week - 1/30/16 |
Other ModernGraham posts about related companies
Dominion Resources Inc Valuation - July 2016 $D | |
M&T Bank Corp Valuation - July 2016 $MTB | |
Citigroup Inc Valuation - July 2016 $C | |
Bank of America Corp Valuation - July 2016 $BAC | |
Fifth Third Bancorp Valuation - July 2016 $FITB | |
Zions Bancorp Valuation - June 2016 $ZION | |
Regions Financial Corp - June 2016 $RF | |
Wells Fargo & Co Valuation - June 2016 $WFC | |
Huntington Bancshares Inc Valuation - June 2016 $HBAN | |
State Street Corp Valuation - June 2016 $STT |
Disclosure: The author did not hold a position in the company mentioned in this article at the time of publication and had no intention of changing that position within the next 72 hours. See my current holdings here. This article is not investment advice; any reader should speak to a registered investment adviser prior to making any investment decisions. ModernGraham is not affiliated with the company in any manner. Please be sure to review our detailed disclaimer. This article first appeared on ModernGraham.
Start a free seven-day trial of Premium Membership to GuruFocus.
This article first appeared on GuruFocus.
Warning! GuruFocus has detected 6 Warning Signs with ADP. Click here to check it out.
The intrinsic value of JPM
