Is Italian Wine Brands Sp.A. (BIT:IWB) A Buy At Its Current PE Ratio?

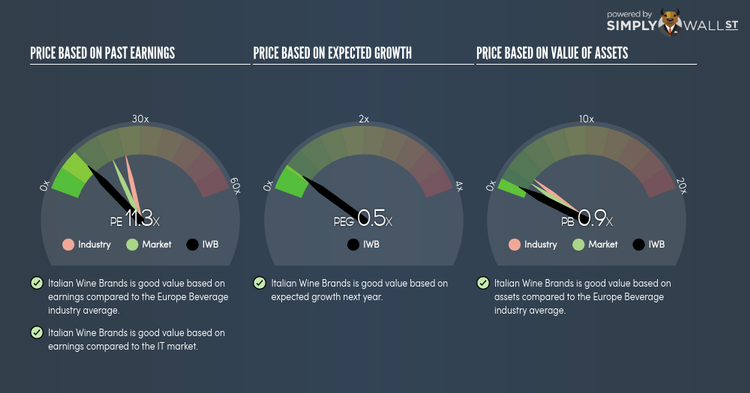
Italian Wine Brands Sp.A. (BIT:IWB) is trading with a trailing P/E of 11.3x, which is lower than the industry average of 24.4x. While IWB might seem like an attractive stock to buy, it is important to understand the assumptions behind the P/E ratio before you make any investment decisions. In this article, I will break down what the P/E ratio is, how to interpret it and what to watch out for. Check out our latest analysis for Italian Wine Brands
What you need to know about the P/E ratio
The P/E ratio is a popular ratio used in relative valuation since earnings power is a key driver of investment value. By comparing a stock’s price per share to its earnings per share, we are able to see how much investors are paying for each dollar of the company’s earnings.
P/E Calculation for IWB
Price-Earnings Ratio = Price per share ÷ Earnings per share
IWB Price-Earnings Ratio = €13.45 ÷ €1.194 = 11.3x
The P/E ratio isn’t a metric you view in isolation and only becomes useful when you compare it against other similar companies. We preferably want to compare the stock’s P/E ratio to the average of companies that have similar features to IWB, such as capital structure and profitability. One way of gathering a peer group is to use firms in the same industry, which is what I’ll do. Since IWB’s P/E of 11.3x is lower than its industry peers (24.4x), it means that investors are paying less than they should for each dollar of IWB’s earnings. Therefore, according to this analysis, IWB is an under-priced stock.
A few caveats
However, before you rush out to buy IWB, it is important to note that this conclusion is based on two key assumptions. Firstly, our peer group contains companies that are similar to IWB. If this isn’t the case, the difference in P/E could be due to other factors. For example, if you compared higher growth firms with IWB, then its P/E would naturally be lower since investors would reward its peers’ higher growth with a higher price. The second assumption that must hold true is that the stocks we are comparing IWB to are fairly valued by the market. If this does not hold, there is a possibility that IWB’s P/E is lower because our peer group is overvalued by the market.
What this means for you:
If your personal research into the stock confirms what the P/E ratio is telling you, it might be a good time to add more of IWB to your portfolio. But keep in mind that the usefulness of relative valuation depends on whether you are comfortable with making the assumptions I mentioned above. Remember that basing your investment decision off one metric alone is certainly not sufficient. There are many things I have not taken into account in this article and the PE ratio is very one-dimensional. If you have not done so already, I highly recommend you to complete your research by taking a look at the following:
Future Outlook: What are well-informed industry analysts predicting for IWB’s future growth? Take a look at our free research report of analyst consensus for IWB’s outlook.
Financial Health: Is IWB’s operations financially sustainable? Balance sheets can be hard to analyze, which is why we’ve done it for you. Check out our financial health checks here.
Other High-Performing Stocks: Are there other stocks that provide better prospects with proven track records? Explore our free list of these great stocks here.
To help readers see pass the short term volatility of the financial market, we aim to bring you a long-term focused research analysis purely driven by fundamental data. Note that our analysis does not factor in the latest price sensitive company announcements.
The author is an independent contributor and at the time of publication had no position in the stocks mentioned.

