Is Interfor Corporation’s (TSE:IFP) ROE Of 15.3% Sustainable?

I am writing today to help inform people who are new to the stock market and want to start learning about core concepts of fundamental analysis on practical examples from today’s market.
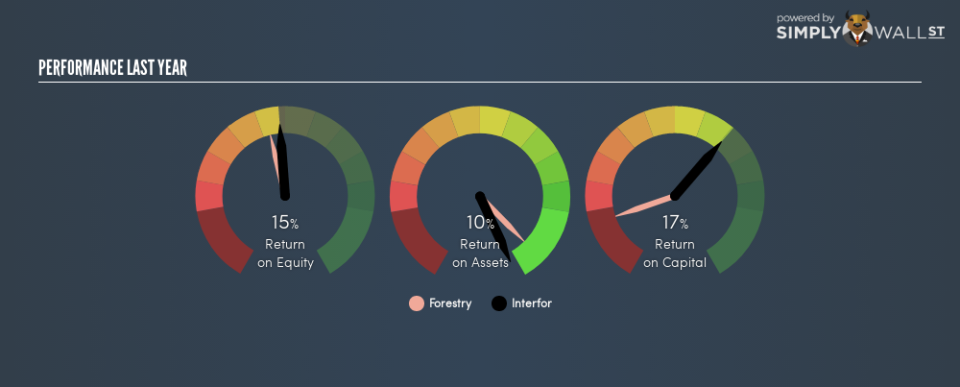
Interfor Corporation (TSE:IFP) outperformed the Forest Products industry on the basis of its ROE – producing a higher 15.3% relative to the peer average of 13.8% over the past 12 months. On the surface, this looks fantastic since we know that IFP has made large profits from little equity capital; however, ROE doesn’t tell us if management have borrowed heavily to make this happen. Today, we’ll take a closer look at some factors like financial leverage to see how sustainable IFP’s ROE is.
See our latest analysis for Interfor
Breaking down Return on Equity
Return on Equity (ROE) is a measure of Interfor’s profit relative to its shareholders’ equity. It essentially shows how much the company can generate in earnings given the amount of equity it has raised. While a higher ROE is preferred in most cases, there are several other factors we should consider before drawing any conclusions.
Return on Equity = Net Profit ÷ Shareholders Equity
ROE is measured against cost of equity in order to determine the efficiency of Interfor’s equity capital deployed. Its cost of equity is 9.6%. This means Interfor returns enough to cover its own cost of equity, with a buffer of 5.7%. This sustainable practice implies that the company pays less for its capital than what it generates in return. ROE can be split up into three useful ratios: net profit margin, asset turnover, and financial leverage. This is called the Dupont Formula:
Dupont Formula
ROE = profit margin × asset turnover × financial leverage
ROE = (annual net profit ÷ sales) × (sales ÷ assets) × (assets ÷ shareholders’ equity)
ROE = annual net profit ÷ shareholders’ equity
Basically, profit margin measures how much of revenue trickles down into earnings which illustrates how efficient the business is with its cost management. The other component, asset turnover, illustrates how much revenue Interfor can make from its asset base. And finally, financial leverage is simply how much of assets are funded by equity, which exhibits how sustainable the company’s capital structure is. Since ROE can be artificially increased through excessive borrowing, we should check Interfor’s historic debt-to-equity ratio. Currently the debt-to-equity ratio stands at a low 26.9%, which means its above-average ROE is driven by its ability to grow its profit without a significant debt burden.

Next Steps:
ROE is one of many ratios which meaningfully dissects financial statements, which illustrates the quality of a company. Interfor’s above-industry ROE is encouraging, and is also in excess of its cost of equity. Its high ROE is not likely to be driven by high debt. Therefore, investors may have more confidence in the sustainability of this level of returns going forward. Although ROE can be a useful metric, it is only a small part of diligent research.
For Interfor, there are three relevant factors you should look at:
Financial Health: Does it have a healthy balance sheet? Take a look at our free balance sheet analysis with six simple checks on key factors like leverage and risk.
Valuation: What is Interfor worth today? Is the stock undervalued, even when its growth outlook is factored into its intrinsic value? The intrinsic value infographic in our free research report helps visualize whether Interfor is currently mispriced by the market.
Other High-Growth Alternatives : Are there other high-growth stocks you could be holding instead of Interfor? Explore our interactive list of stocks with large growth potential to get an idea of what else is out there you may be missing!
To help readers see past the short term volatility of the financial market, we aim to bring you a long-term focused research analysis purely driven by fundamental data. Note that our analysis does not factor in the latest price-sensitive company announcements.
The author is an independent contributor and at the time of publication had no position in the stocks mentioned. For errors that warrant correction please contact the editor at editorial-team@simplywallst.com.

