
Infographic: Key Stats and Findings from the 2016 U.S. APEAL Study
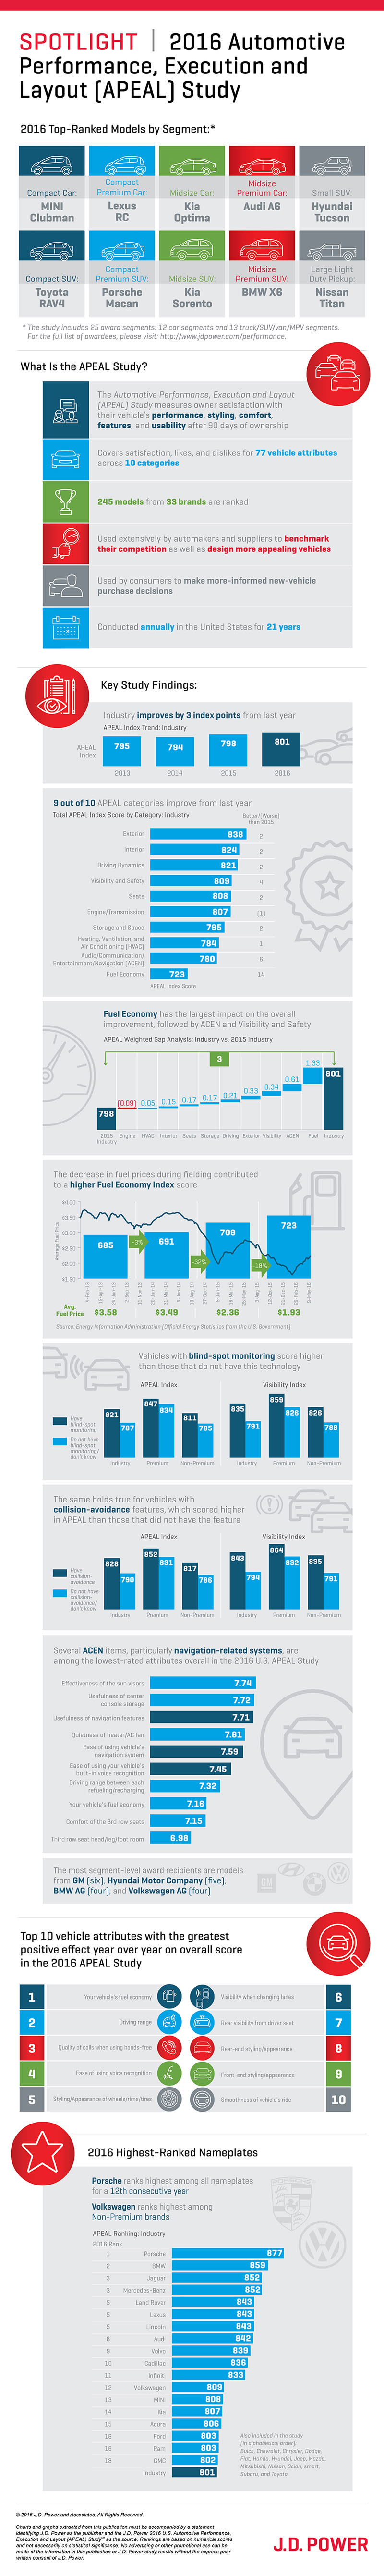
Conducted annually, the J.D. Power U.S. Automotive Performance, Execution and Layout (APEAL) Study,SM now in its 21st year, measures owner satisfaction with their vehicle’s performance, styling, comfort, features, and usability after 90 days of ownership. It covers satisfaction, likes, and dislikes for 77 vehicle attributes across 10 categories. In the 2016 study, 245 models from 33 brands are ranked.
Categories include:
Exterior
Interior
Driving Dynamics
Visibility and Safety
Seats
Engine/Transmission
Storage and Space
Heating, Ventilation, and Air Conditioning (HVAC)
Audio/Communication/Entertainment/Navigation (ACEN)
Fuel Economy
Nine of the 10 categories measured in the study improve in 2016, with Fuel Economy posting the largest gain: up 14 points (on a 1,000-point scale) year over year.
In the infographic that follows, we present some key statistics and findings from the 2016 U.S. APEAL Study.
Additional Research:
Abstract:
The J.D. Power U.S. Automotive Performance, Execution and Layout (APEAL) Study, now in its 21st year, measures owner satisfaction with their vehicle’s performance, styling, comfort, features, and usability. Discover the top models in each category of the 2016 U.S. APEAL Study with this exclusive infographic.
Year:
2 016
Check this if this is NOT an Articles Listing Page:
New or Used:
New
Display Article Date?:
Article Is Flipbook:
No

