These Before And After Images Show The Startling Effects Of Climate Change

WASHINGTON — As the Trump administration and numerous U.S. lawmakers, primarily conservatives, downplay the threat of climate change and take aim at policies to combat it, researchers are documenting undeniable transformations around the globe.
A United Nations-backed study published in January, for example, concluded that unless we take swift action to curb greenhouse gas emissions, coral bleaching events — like the one that resulted in a major die-off at Australia’s Great Barrier Reef — will soon decimate nearly all of the world’s coral reefs.
And just last week, the U.S. Geological Survey and Portland State University released data showing the dramatic melting of glaciers in Montana. Since 1966, climate change has reduced the size of 39 glaciers, some by as much as 85 percent.
Earlier this year, NASA published “Images of Change,” a gallery of more than 100 startling before and after pictures — most taken from space — that “show our planet in a state of flux.” The photos capture everything from natural disasters to urban growth and volcanic eruptions. Here, we’ve selected images that specifically show how climate change is affecting landscapes in different parts of the world.
The image below shows Glacier National Park in August 1984 (left), compared to August 2015 (right). In 1850, the area contained roughly 150 glaciers, compared to just 25 today, many “mere remnants of what they once were,” according to the National Park Service. If the current rate of warming continues, Glacier could be free of the features for which it is named by 2030.
On average, the world’s glaciers are losing ice at three times the rate lost in the 1980s, according to a 2015 study. And roughly 69 percent of the rapid melting of Earth’s glaciers can be linked to human activity, including the burning of fossil fuels, a 2014 report found.
Below are images of Neumayer Glacier, on South Georgia Island in the southern Atlantic, in January 2005 (left), and in September 2016 (right). Since 2000, Neumayer has retreated more than 2.5 miles.
The images below show Pedersen Glacier, in southern Alaska, sometime between the mid-1920s and the early 1940s (left), and in August 2005 (right). In that 60- to 80-year period, the glacier’s terminus retreated more than 1.2 miles.
Below are images of Northwestern Glacier, in southern Alaska, sometime between the mid-1920s and the early 1940s (left), compared to August 2005 (right). During that 60- to 80-year period, the glacier’s terminus retreated more than 6.2 miles.
Love HuffPost? Become a founding member of HuffPost Plus today.
The images below show Muir Glacier, also in southern Alaska, first in August 1941 (left) and again in August 2004 (right). Between the 1890s and 2005, Muir retreated more than 30 miles, according to USGS.
Climate change, driven by greenhouse gas emissions, has also triggered accelerated melting in Antarctica and caused the Arctic to warm “faster than any other region on Earth.”
The image below shows the Bellinghausen Coast, in western Antarctica, in February 1975 (left) and again in March 2015 (right). Over the last four decades, West Antarctica’s coastline has lost about 390 square miles of ice, according to a study last year led by researchers at the University of Edinburgh.
The graphic below shows the decline in Arctic sea ice between September 1984 (left) and September 2016 (right). Over that 32-year period, the area covered by ice at least four years old has plummeted from 718,000 square miles to 42,000 square miles.
See the rest of NASA’s “Images of Change” here.
Related Coverage
Glaciers' Rapid Retreat Should Be 'Alarm Bell To Everyone's Ears'
As Ice Melts, Dangerous Diseases From The Past Could Rise Again
Montana's Melting Glaciers On Pace To All But Disappear 'Within 20 Years'
The World’s Glaciers are Melting (VIDEO)
Also on HuffPost
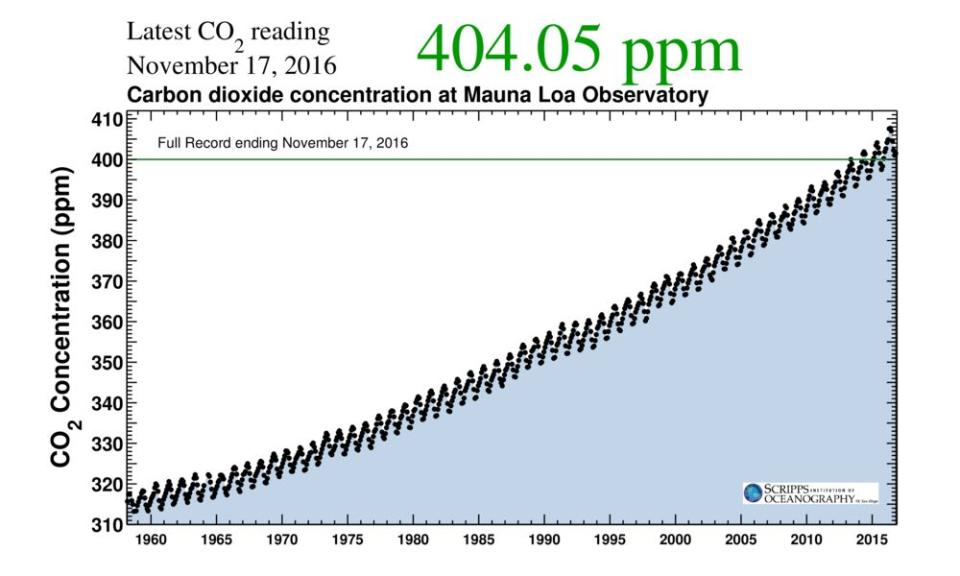
Our carbon footprint says it all.
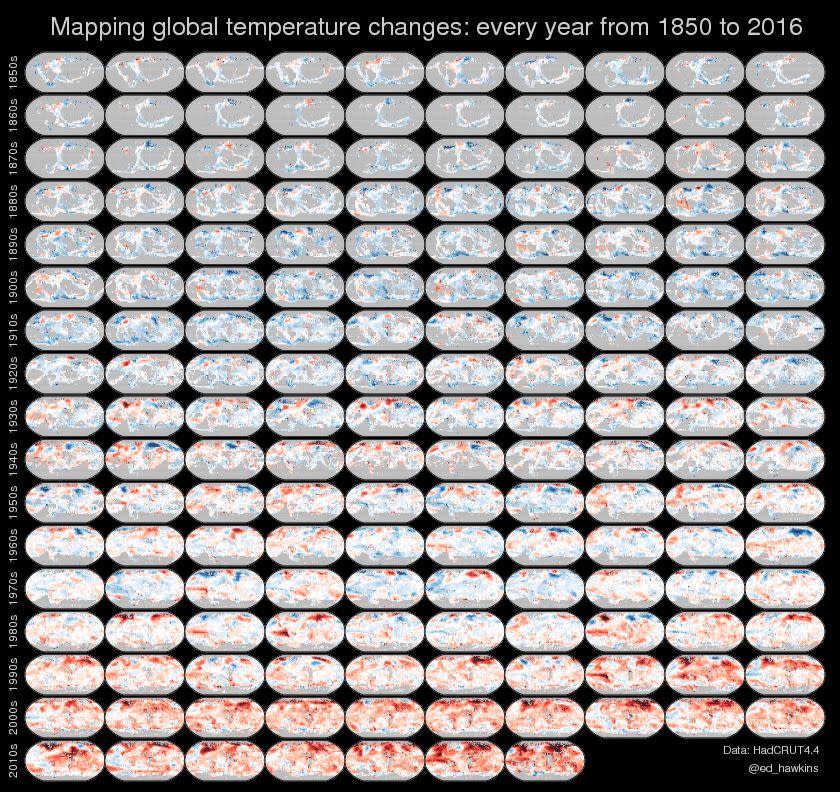
Year over year, the trend becomes more obvious.
Spiralling global temperatures | updated to August 2016: https://t.co/rPSSxkS2mn pic.twitter.com/yMo0GNAsxk
— Ed Hawkins (@ed_hawkins) September 30, 2016
Another 2016 record—August tied w/ July for warmest in 136 years: https://t.co/69uzcZP2BX #dataviz #climatechange pic.twitter.com/jWkGiabPiP
— Joshua Stevens (@jscarto) September 12, 2016
2016 #Arctic sea ice minimum ties with 2007 for 2nd lowest. https://t.co/BGLZYZvGMY pic.twitter.com/vJghT6HGDc
— Arctic Sea Ice News (@NSIDC_ArcticIce) September 15, 2016
This article originally appeared on HuffPost.

