As heat waves intensify, tens of thousands of US classrooms will be too hot for students to learn in
Rising temperatures due to climate change are causing more than just uncomfortably hot days across the United States. These high temperatures are placing serious stress on critical infrastructure such as water supplies, airports, roads and bridges.
One category of critical infrastructure being severely affected is the nation’s K-12 schools.
Ideally, the nation’s more than 90,000 public K-12 schools, which serve over 50 million students, should protect children from the sometimes dangerous elements of the outdoors such as severe storms or extreme temperatures.
But since so many of America’s schools are old and dilapidated, it’s the school buildings themselves that need protection – or at least to be updated for the 21st century.
Twenty-eight percent of the nation’s public schools were built from 1950 through 1969, federal data shows, while just 10% were built in 1985 or later.
As a researcher who studies the impact of climate change, I have measured its effects on infrastructure and health for over a decade. During that time, I’ve seen little attention focused on the effects of climate change on public schools.
Since 2019, climate scientist Sverre LeRoy, at the Center for Climate Integrity, and I have worked to determine if the nation’s schools are prepared for the heat waves on the approaching horizon.
Comparing the climate conditions under which U.S. schools were built with the projected conditions over the next two decades, we looked at the vulnerability of all K-12 schools to increasing temperatures. We determined whether current schools have air conditioning or not and whether they would be required to add air conditioning in the future.
The results of our study, “Hotter Days, Higher Costs: The Cooling Crisis in America’s Classrooms,” show that by 2025, more than 13,700 schools will need to install air conditioning, and another 13,500 will need to upgrade their existing systems.
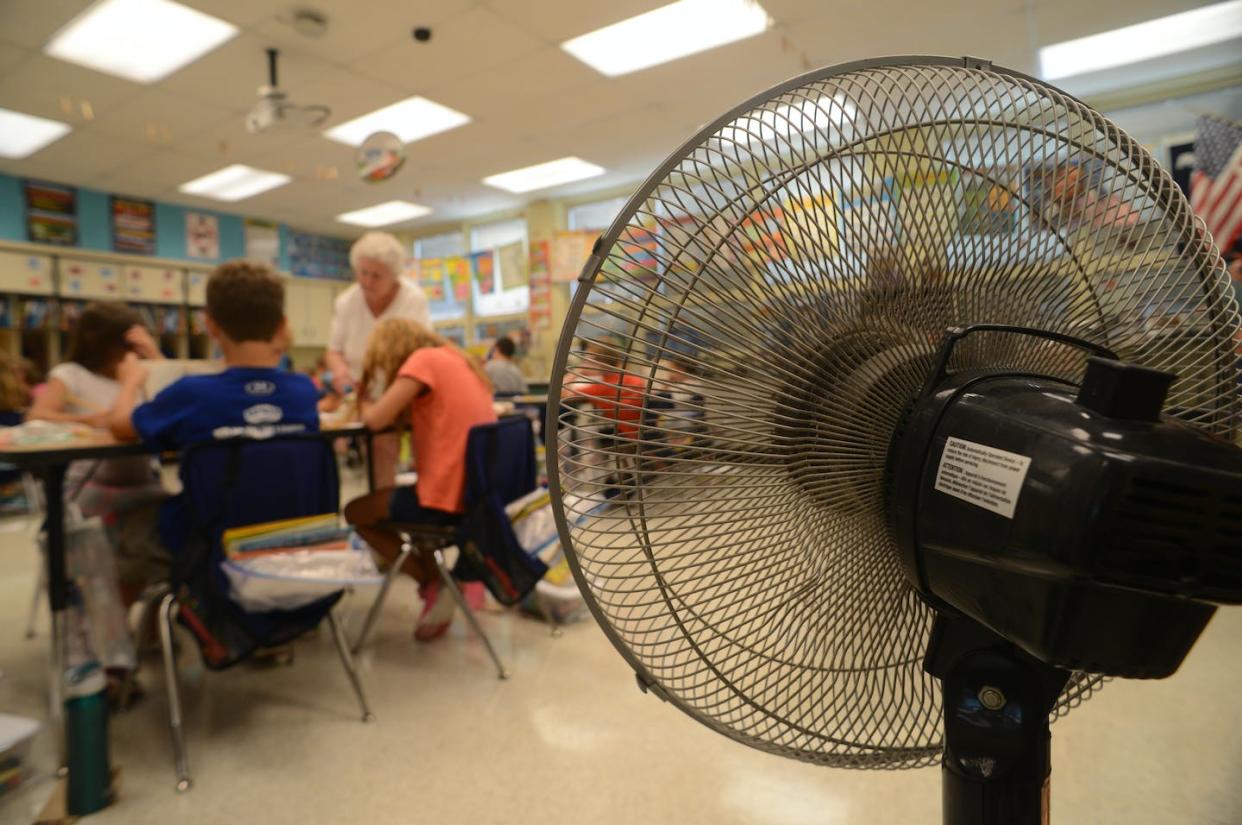
Hot classrooms
Research has shown that high classroom temperatures can make it harder to learn. Hot school days cause difficulty in concentrating, sleepiness, a decrease in energy and even reduced memory capacity.
Local school districts have policies for extreme heat events. However, rising temperatures mean these guidelines are no longer limited to rare occurrences.
Over the past several years, schools across the U.S. are increasingly forced to take “heat days,” cutting school days short because of classrooms that are too hot for students to effectively learn.
This is happening in places that range from Denver to Baltimore and Cleveland.
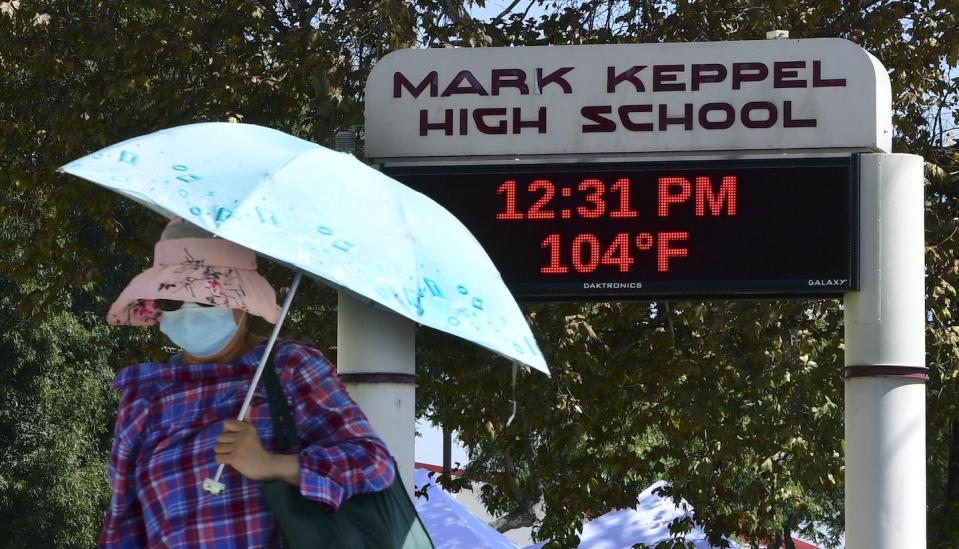
Compounding the increase in temperatures is the national trend that seasonal temperatures are rising in both the spring and the fall. For example, both Rhode Island and New Jersey have seen average spring and fall temperatures rise over 3 degrees Fahrenheit (1.7 Celsius). Rather than high temperatures only occurring when students are on summer break, these heat events now occur regularly during the school year too. Students today in a greater number of cities are beginning and ending the school year in classrooms that often exceed 80 F (27 C).
Expensive upgrades
The problem of more hot days is due to average temperatures increasing over the past 40 years. The number of days with high temperatures has risen across the country, with notable increases in large northern cities. For example, Chicago has seen the number of days over 80 degrees during the school year increase from 27 in 1970 to 32 in 2020 and a projected 38 by 2025. These increases affect schools in two distinct ways.
Schools in the traditionally cooler north – especially older schools – will need to be retrofitted with new air conditioning systems at an accumulated cost of US billion by 2025. For schools in the traditionally warmer South and West, many existing systems will need to be upgraded at a projected cost exceeding 0 million.
Temperature increases are especially costly in large cities such as Philadelphia, Chicago and Los Angeles, where existing efforts and continued needs will result in outlays exceeding 0 million,

The official 2023 hurricane season forecasts were just released, and while the Atlantic may see an average storm season this year, a busier-than-normal season is forecast in the eastern Pacific, meaning heightened risks for Mexico and Hawaii.
A big reason is El Niño.
El Niño typically means trouble for the Pacific and a break for the Atlantic coast and Caribbean. But while this climate phenomenon is highly likely to form this year, it isn’t a certainty before hurricane season ramps up this summer, and that makes it harder to know what might happen.
It’s also important to remember that even in quiet years, a single storm can cause enormous destruction.


As climate scientists, we study how climate patterns related to the frequency and intensity of hurricanes – information that is used to develop seasonal forecasts. Here is a quick look at how El Niño affects storms and why it tends to cause opposite effects in two basins separated only by a narrow stretch of land.
A tale of two basins
It’s helpful to start by visualizing where tropical storms develop in each ocean.
In the North Atlantic, tropical storms typically form over the warm waters west of Africa. As they move westward, they often hit Caribbean islands before making landfall on the U.S. Gulf Coast and Eastern Seaboard, or they curve off into the Atlantic.
Those tropical storms and hurricanes have caused over a trillion dollars in damage in the U.S. since 1981. That damage is expected to continue to increase, both because warming global temperatures fuel stronger storms and because more people are building homes and businesses in harm’s way.
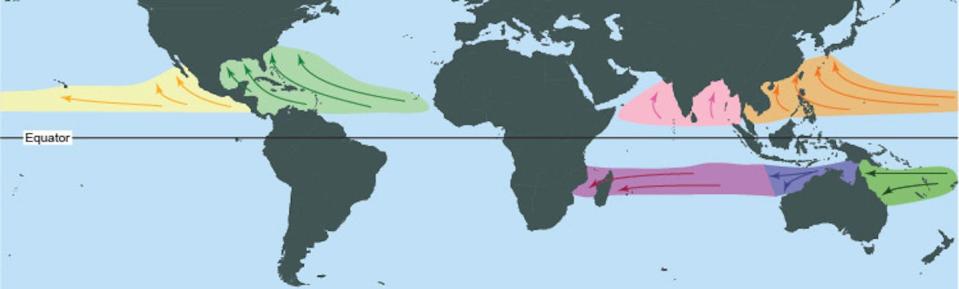
In the eastern North Pacific, tropical storms tend to form closer to land, between Mexico and Clipperton Island off Central America. They typically move to the northwest before turning westward out to sea, sometimes inundating the Mexican coast known as the Mexican Riviera. Longer-tracked Pacific storms that move into the central Pacific can affect shipping and hit Hawaii, as Hurricane Lane did in 2018.
While the Atlantic gets the most attention, largely because it gets more damage with more people and property in the way, the Pacific tends to get more storms, especially during El Niño years. It’s often a seesaw pattern, with a busy year in one basin and a quieter season in the other.

El Niño creates a seesaw pattern
That seesaw pattern is largely driven by the El Niño-Southern Oscillation, or ENSO, which includes varying strengths of El Niño and its opposite, La Niña.
During El Niño, the trade winds that blow from east to west weaken, allowing warm ocean water to build up at the equator, west of South America. This causes a shift in the jet streams – strong upper-level winds – which affects rainfall and temperature patterns.
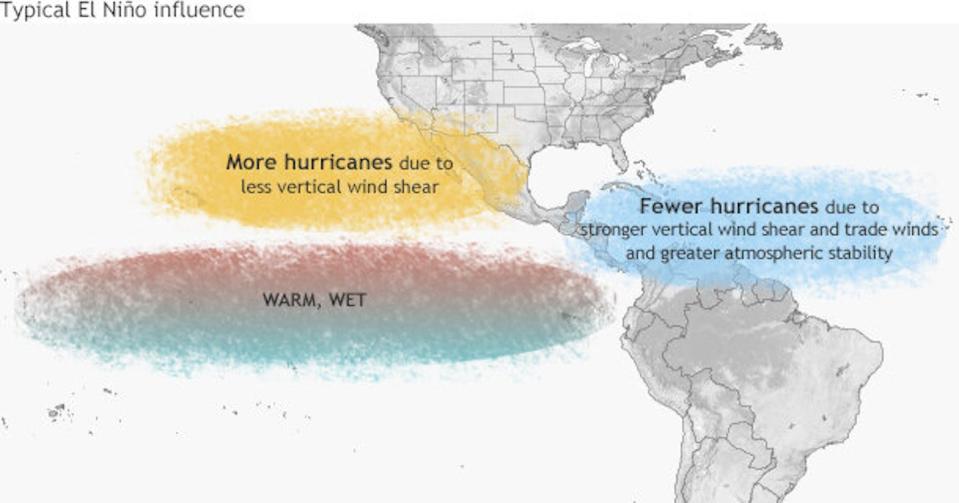
In the Atlantic Ocean, El Niño causes an area of low pressure in the upper atmosphere known as a trough and stronger upper-level winds, resulting in increased vertical wind shear – a change in wind speed or direction with height in the atmosphere. Wind shear can tilt and stabilize storms, allowing fewer hurricanes to form.
Conversely, El Niño typically causes an upper-level ridge, or area of high pressure, and decreased vertical wind shear in the eastern North Pacific basin, and often results in an active hurricane season.
La Niña – El Niño’s opposite, with cooler water in the tropical Pacific – reverses this pattern. The record 2020 and destructive 2021 Atlantic hurricane seasons were both during strong La Niña years.
On longer time scales, the Atlantic Multidecadal Oscillation, a fluctuation of North Atlantic sea surface temperatures, affects hurricane activity in cycles that span several decades. The AMO’s current warm phase, which began in 1995, has hosted seven of the 10 busiest Atlantic hurricane seasons. Hurricane activity often lessens in a cool phase of the AMO, during which the Atlantic is on average about 1 degree Fahrenheit (0.6 Celsius) cooler.
Who faces the greatest risk in the Pacific?
El Niño also changes who is at risk in the Pacific.
During El Niño events, storms in the eastern North Pacific tend to form farther to the west. With these events, the environmental conditions in the western portion of the basin tend to become more conducive than normal to tropical cyclones, such as having reduced environmental vertical wind shear and warmer ocean temperatures. That places Hawaii and the central Pacific at greater risk from damaging storms than normal.
The highly destructive Hurricanes Manuel in 2013 and Willa in 2018 show the immense impact Pacific storms can have in the region. Both triggered widespread flooding and mudslides in Mexico, and together led to over 125 deaths. In Hawaii, Hurricane Iniki’s storm surge and winds in 1992 destroyed over 1,400 homes on Kauai and damaged thousands more.
El Niño years also increase the viability of storms affecting the southwestern U.S. In 1997, multiple storms affected California and Arizona, including some that moved into the region after landfall in Mexico. Famously, in 2014, rough surf and swells associated with Hurricane Marie caused over US million in damage at the Port of Long Beach.
Why 2023 hurricane forecasts are so uncertain
Forecasting the 2023 hurricane seasons is proving to be challenging for another reason: The Atlantic has abnormally warm sea surface temperatures this year, and that can power hurricanes – if storms are able to form.
Will the warm waters of the Atlantic overcome the unfavorable conditions brought by the El Niño? We’ll soon know.
The eastern Pacific hurricane season started May 15, and the Atlantic season starts June 1, with both running through Nov. 30.
In its 2023 Atlantic hurricane outlook released in late May, the National Oceanic and Atmospheric Administration forecast 12 to 17 named storms, five to nine hurricanes and one to four major hurricanes. In the eastern Pacific, NOAA forecasts 14 to 20 named storms, seven to 11 hurricanes and four to eight major hurricanes. For the central Pacific, including Hawaii, NOAA’s forecast includes four to seven cyclones, also above or close to average.
Surprisingly, the Atlantic has already seen its first storm of the year – a storm in January was recently classified as a subtropical cyclone. This is rare. Our research shows the median date of the first named tropical cyclone is May 30 in the Pacific and June 20 in the Atlantic, though Atlantic storms have been occurring, on average, earlier each year. We should expect the next named Atlantic and Pacific storms – Arlene and Adrian, respectively – in the coming weeks.
This article was updated May 30, 2023, to corrects reference to storms forming off Africa.
This article is republished from The Conversation, a nonprofit news site dedicated to sharing ideas from academic experts. If you found it interesting, you could subscribe to our weekly newsletter.
It was written by: Kelsey Ellis, University of Tennessee and Nicholas Grondin, University of Tennessee.
Read more:
Kelsey Ellis receives funding from the National Oceanic and Atmospheric Administration and the National Science Foundation.
Nicholas Grondin does not work for, consult, own shares in or receive funding from any company or organization that would benefit from this article, and has disclosed no relevant affiliations beyond their academic appointment.

