Gold’s Recovery Makes A Pause At 1,300 Ahead Of US Data
Gold and Silver are trading negative on Monday as both metals are taking a breath after the rally performed on Friday. Investors are waiting now for a new catalyst.
Safe havens instruments rallied on Friday amid a weak Non-farm payrolls data that spurred concerns on the global economy.
Last week, the ECB announced a more than expected dovish stance and China published weaker exports and imports numbers.
So, investors became worried about expectations for global economic growth.
On Friday, the United States reported 20K jobs created in February. While a weak number was expected due to the US government shutdown, the number was well below the 180K new jobs waited for the market.
US data to become the new catalyst
The United States will publish its Retail Sales report for January with the market expecting a 0.1% decline in the first month of the year.
Ex-autos, retail sales would rise by 0.2% in January, according to market expectations.
Any weaker number than expectations would add fuel to any rally for commodities.
Gold tests 1,3000 area; ready for another run
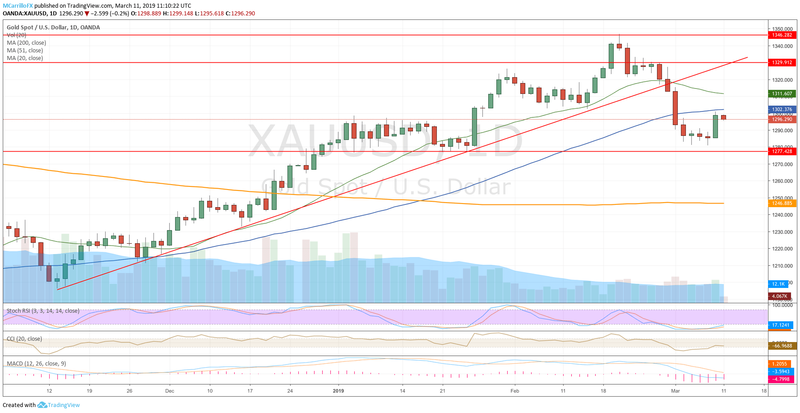
Gold is currently trading at 1,295, 0.21% negative on the day as the unit is trading in consolidation mood following a rally performed on Friday.
The XAU/USD is currently testing the 1,300 area with the 50-day moving average at 1,302 acting as resistance.
“Today’s price action indicates that investors may be waiting for the release of today’s U.S. retail sales report before making their next move,” FX Empire analyst James Hyerczyk said.
“Friday’s rally was fueled by a mixed U.S. employment report so a weaker-than-expected retail sales report will likely lead to a continuation of this chart pattern.”
Weak retail sales will possibly drive gold higher as it will add to worries about a slowing domestic economy.
“The fall this morning is a temporary occurrence due to some early morning profit taking after Friday’s move up,” Jeffrey Halley, a senior market analyst at OANDA said in a report by CNBC.
“The U.S. dollar is mostly stronger, and that is adding some downward pressure on gold.”
Technically, gold is well positioned to add more gains in the middle and long term.
The global economic growth is giving signs of exhaustion and political problems are happening in all cardinal points.
To the upside, investors should pay attention to the 50-day moving average line and February lows around 1,302 as immediate resistance. Above that, 1,315 and 1,330 are the next frontiers.
To the downside, 1,280 seems to be a solid support with 1,275 as 2019 lows. Below those levels, watch for 1,260 and 1,245 as important buying zones.
Silver down on consolidation pattern
Silver is trading negative on Monday as investors are waiting for a new catalyst after Friday’s rally. Also, XAG/USD is mimicking Gold’s performance.
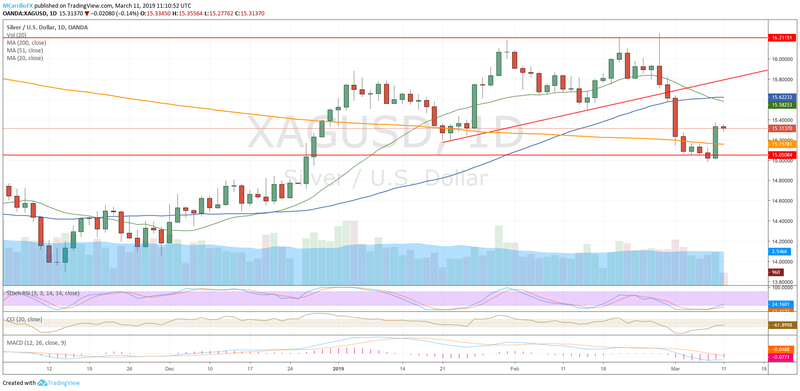
XAU/USD is currently moving around 15.30, 0.15% negative on the day as the pair was unable to break above the 15.40 level on Friday.
To the upside, 15.50 will be the next resistance. Above there, 15.60 looks like the most important selling zone in the middle term.
To the downside, appetite for USD would send silver to 15.00, where it will trade sideways.
This article was originally posted on FX Empire
