Gold Daily Analysis – August 7, 2017
Gold prices fell on Friday and continue to drop on Monday morning as a result of the NFP report which raises investors’ hope towards another rate hike this year.
According to the report – The unemployment rate in U.S declined to 4.3%. Wages increased by 2.5% on a year-on-year basis.
Technical Outlook
Gold closed near the support line which is the 50 Day moving average as well. Once again, as gold still trades in a side ways, we can see the Long term 100-day moving average crosses above the Short term 50-day moving average. This indicates a bullish momentum.
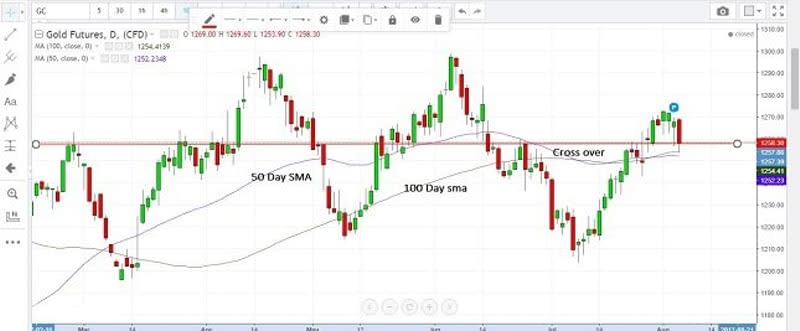
Additional support could be seen at 100 day moving average $1251. A break below support will enable selling momentum towards $1240.
Gold was unable to close above $1273 for the past week. A break and a close above could lead towards $1283-1300 levels.
This article was originally posted on FX Empire
