General Electric Company (GE): Does -2.6% EPS Drop In A Year Reflect The Long-Term Trend?

After looking at General Electric Company’s (NYSE:GE) latest earnings announcement (30 September 2017), I found it useful to revisit the company’s performance in the past couple of years and assess this against the most recent figures. As a long term investor, I pay close attention to earnings trend, rather than the figures published at one point in time. I also compare against an industry benchmark to check whether General Electric’s performance has been impacted by industry movements. In this article I briefly touch on my key findings. Check out our latest analysis for General Electric
Did GE perform worse than its track record and industry?
To account for any quarterly or half-yearly updates, I use the ‘latest twelve-month’ data, which either annualizes the most recent 6-month earnings update, or in some cases, the most recent annual report is already the latest available financial data. This technique allows me to examine various companies on a similar basis, using the most relevant data points. General Electric’s latest twelve-month earnings is $7,584M, which compared to last year’s figure, has fallen by -7.73%. Since these figures are fairly myopic, I have determined an annualized five-year value for GE’s earnings, which stands at $10,103M. This doesn’t look much better, since earnings seem to have gradually been falling over the longer term.
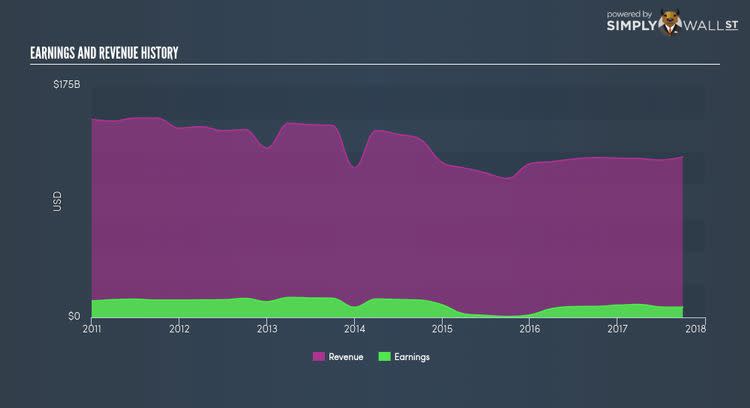
Why is this? Let’s examine what’s transpiring with margins and whether the entire industry is experiencing the hit as well. Although revenue growth over the past couple of years, has been negative, earnings growth has been declining by even more, implying that General Electric has been growing its expenses. This hurts margins and earnings, and is not a sustainable practice. Scanning growth from a sector-level, the US industrial conglomerates industry has been growing, albeit, at a unexciting single-digit rate of 8.12% over the previous twelve months, and 6.66% over the past five. This shows that any tailwind the industry is enjoying, General Electric has not been able to realize the gains unlike its industry peers.
What does this mean?
While past data is useful, it doesn’t tell the whole story. Usually companies that endure a prolonged period of diminishing earnings are undergoing some sort of reinvestment phase in order to keep up with the latest industry expansion and disruption. I recommend you continue to research General Electric to get a better picture of the stock by looking at:
1. Future Outlook: What are well-informed industry analysts predicting for GE’s future growth? Take a look at our free research report of analyst consensus for GE’s outlook.
2. Financial Health: Is GE’s operations financially sustainable? Balance sheets can be hard to analyze, which is why we’ve done it for you. Check out our financial health checks here.
3. Other High-Performing Stocks: Are there other stocks that provide better prospects with proven track records? Explore our free list of these great stocks here.
NB: Figures in this article are calculated using data from the last twelve months, which refer to the 12-month period ending on the last date of the month the financial statement is dated. This may not be consistent with full year annual report figures.
To help readers see pass the short term volatility of the financial market, we aim to bring you a long-term focused research analysis purely driven by fundamental data. Note that our analysis does not factor in the latest price sensitive company announcements.
The author is an independent contributor and at the time of publication had no position in the stocks mentioned.
