What Can We Expect for Image Resources NL (ASX:IMA) Moving Forward?

Image Resources NL (ASX:IMA), a AUDA$71.41M small-cap, is a metals and mining operating in an industry which is sensitive to changes in the business cycle, as it supplies materials for construction activities. Basic material analysts are forecasting for the entire industry, a positive double-digit growth of 25.15% in the upcoming year , and a whopping growth of 41.20% over the next couple of years. This rate is larger than the growth rate of the Australian stock market as a whole. In this article, I’ll take you through the sector growth expectations, and also determine whether IMA is a laggard or leader relative to its basic materials sector peers. View our latest analysis for Image Resources NL
What’s the catalyst for IMA’s sector growth?
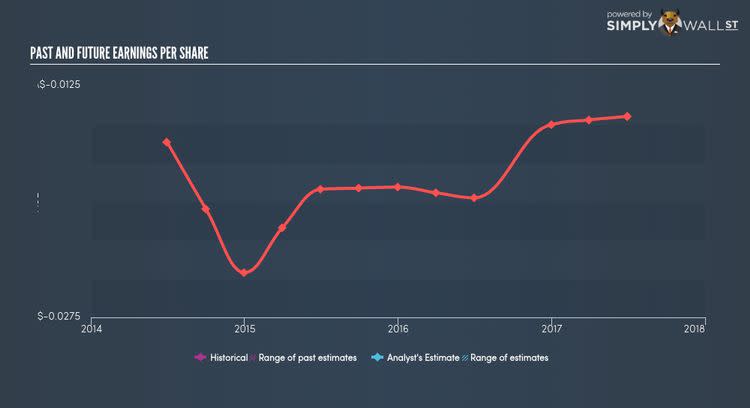
Overall, the basic materials sector seems to be predominantly mature in terms of its industry life cycle. Companies appear to be highly competitive and consolidation seems to be a common theme. There are plenty of emerging trends to deal with across the board including the reduction of waste, raw material inflation, and innovation in global supply chain management. Over the past year, the industry saw growth of 6.76%, beating the Australian market growth of 5.37%. IMA lags the pack with its sustained negative earnings over the past couple of years. The company’s outlook seems uncertain, with a lack of analyst coverage, which doesn’t boost our confidence in the stock. This lack of growth and transparency means IMA may be trading cheaper than its peers.
Is IMA and the sector relatively cheap?
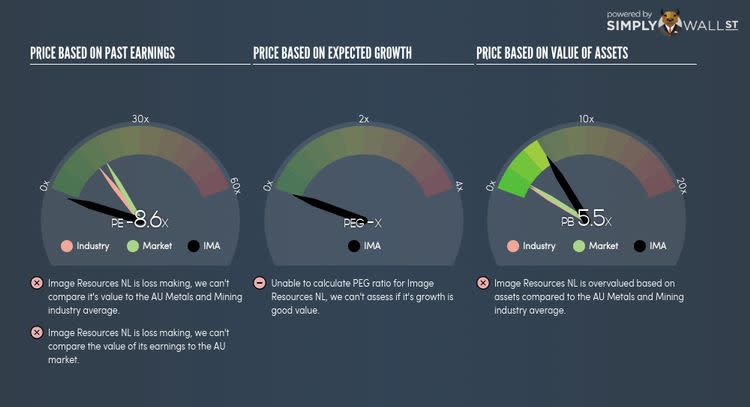
The metals and mining sector’s PE is currently hovering around 14x, in-line with the Australian stock market PE of 17x. This illustrates a fairly valued sector relative to the rest of the market, indicating low mispricing opportunities. Furthermore, the industry returned a similar 11.83% on equities compared to the market’s 11.92%. Since IMA’s earnings doesn’t seem to reflect its true value, its PE ratio isn’t very useful. A loose alternative to gauge IMA’s value is to assume the stock should be relatively in-line with its industry.
What this means for you:
Are you a shareholder? IMA recently delivered an industry-beating growth rate in earnings, which is a positive for shareholders. If you’re bullish on the stock and well-diversified by industry, you may decide to hold onto IMA as part of your portfolio. However, if you’re relatively concentrated in metals and mining, you may want to value IMA based on its cash flows to determine if it is overpriced based on its current growth outlook.
Are you a potential investor? If IMA has been on your watchlist for a while, now may be the time to enter into the stock, if you like its ability to deliver growth and are not highly concentrated in the metals and mining industry. Before you make a decision on the stock, take a look at IMA’s cash flows and assess whether the stock is trading at a fair price.
For a deeper dive into Image Resources NL’s stock, take a look at the company’s latest free analysis report to find out more on its financial health and other fundamentals. Interested in other basic materials stocks instead? Use our free playform to see my list of over 2000 other basic materials companies trading on the market.
To help readers see pass the short term volatility of the financial market, we aim to bring you a long-term focused research analysis purely driven by fundamental data. Note that our analysis does not factor in the latest price sensitive company announcements.
The author is an independent contributor and at the time of publication had no position in the stocks mentioned.

