Eclipse maps of the past show the evolution of science and civilization
The total solar eclipse on August 21 is expected to help shed light on “a number of unique science and engineering problems,” according to NASA. In fact, solar eclipses have long been scientifically important: during these moments of darkness, rare nature observations are made and certain mysteries are illuminated.
Historical eclipse maps show the important role that solar events have played in the evolution of knowledge. The cartography reflects not only scientific advances over time but also shifting human thinking. “Eclipse maps are remarkable artifacts of our civilization,” writes cartographer Michael Zeller, who has compiled a comprehensive online gallery of them.
While diagrams of solar events have long existed, eclipse cartography—maps predicting and tracking celestial activity and its influence on Earth—are relatively new. They flourished in the Age of Enlightenment, from about 1650 to 1800, when belief in the power of rational thought—and not just belief in the power of god—took hold among western thinkers.
These thinkers argued that the universe is explainable with observation and study. The 18th century philosopher Immanuel Kant believed that the enlightenment period marked humanity’s maturity, as people acquired the audacity to think independently. He gave the age the motto Sapere Aude!—Latin for “dare to know!”
Knowledge was increasingly championed, and eclipse cartography grew fashionable. “The emergence of eclipse maps represents the convergence of several advances in scientific thought—the heliocentric model developed by Nicolaus Copernicus, Johann Kepler’s laws of planetary motions developed from Tycho Brahe’s measurements, and new geographic knowledge spanning the old and the new world with a system of longitude and latitude values,” Zeller explains.
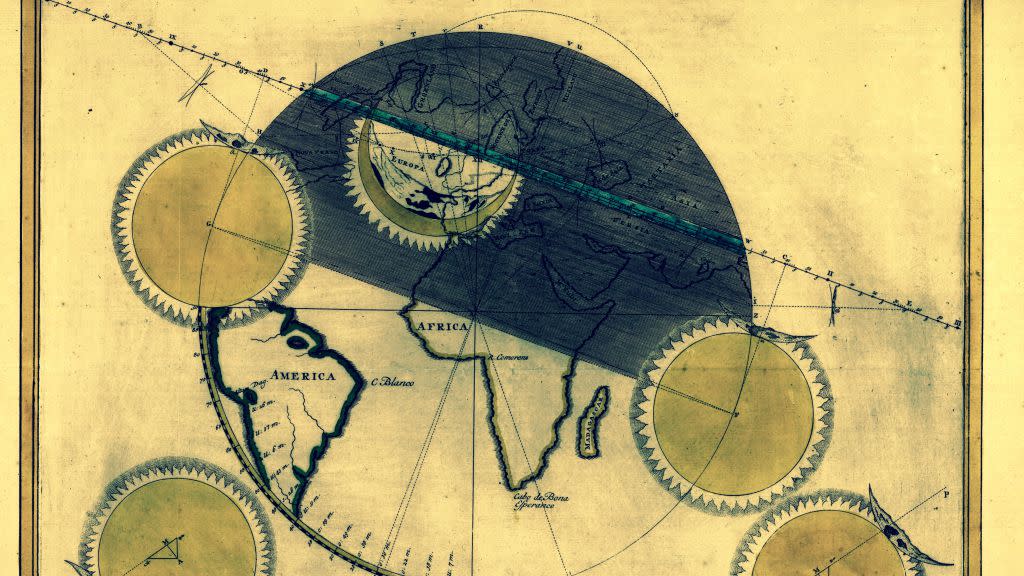
The earliest known solar eclipse map was created in 1654 by a German astronomer, mathematician, and professor, Erhard Weigel:
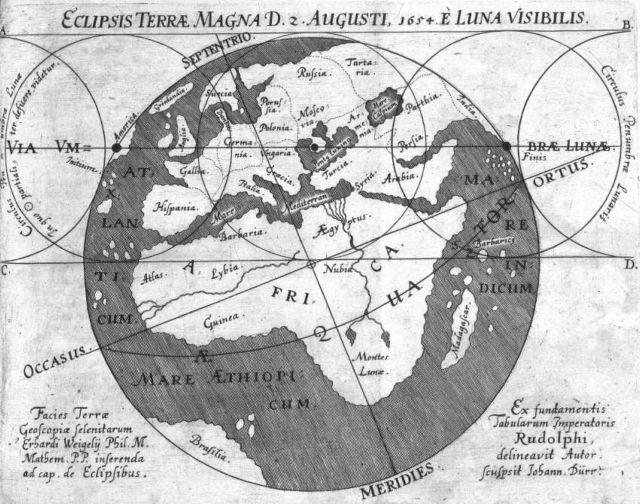
The first eclipse map of August 12, 1654 by Erhard Weigel in Germany.
In Weigel’s 17th century map, the circles represent the shadow of the moon and the straight line marked “Via Umbra Luna” shows the path of totality. While the geography’s slightly wonky, the eclipse’s path of totality is depicted as straight rather than spherical, and the calculations are imperfect, Zeller says that the map is “a credible depiction of this total solar eclipse” based on calculations made with today’s geographic information system software.
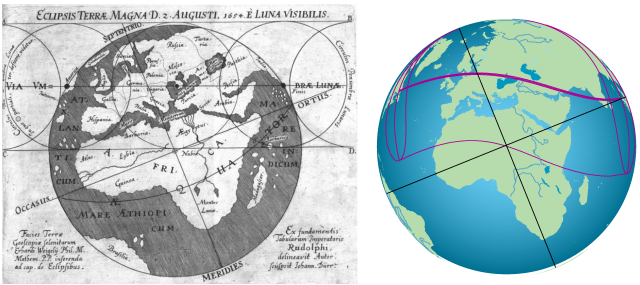
Using geographic information system software and current calculations, the first map proves not bad.
Eclipse maps soon grew more sophisticated. The May 12, 1706 event passed across Europe from Morocco to Siberia and was the subject of at least four different maps. Among them was this colorful contribution by Dutch cartographer Johann Homann and astronomer Johann Doppelmayr, which had details not before seen in this type of cartography.
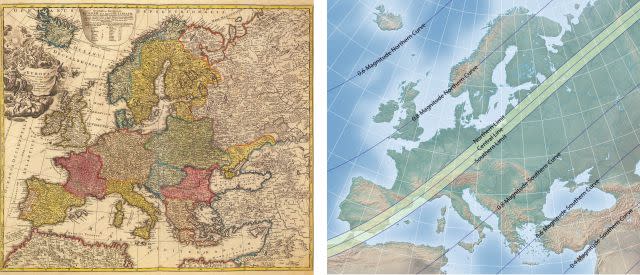
1706 Eclipse map by Homann with contemporary comparison.
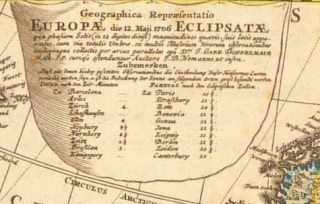
Eclipse times in various cities.
“This is perhaps the first eclipse map to show the umbral path”—the umbra is the dark core of the eclipse shadow—”with southern and northern limit lines,” Zeller explains. “The detail in the upper left of the map lists totality duration and maximum eclipse for a number of European cities,” he writes. This (shown, enlarged, to the right) was a new cartographic feature.
A decade later, Edmund Halley applied Isaac Newton’s universal theory of gravitation to create a 1715 eclipse map which cartographers today consider highly accurate. Halley’s map showed the passage of the shadow of the moon over England, manifesting in the shadow of gray crossing the map diagonally. The darker gray elliptical shape within that sweeping shadow represents the umbra.
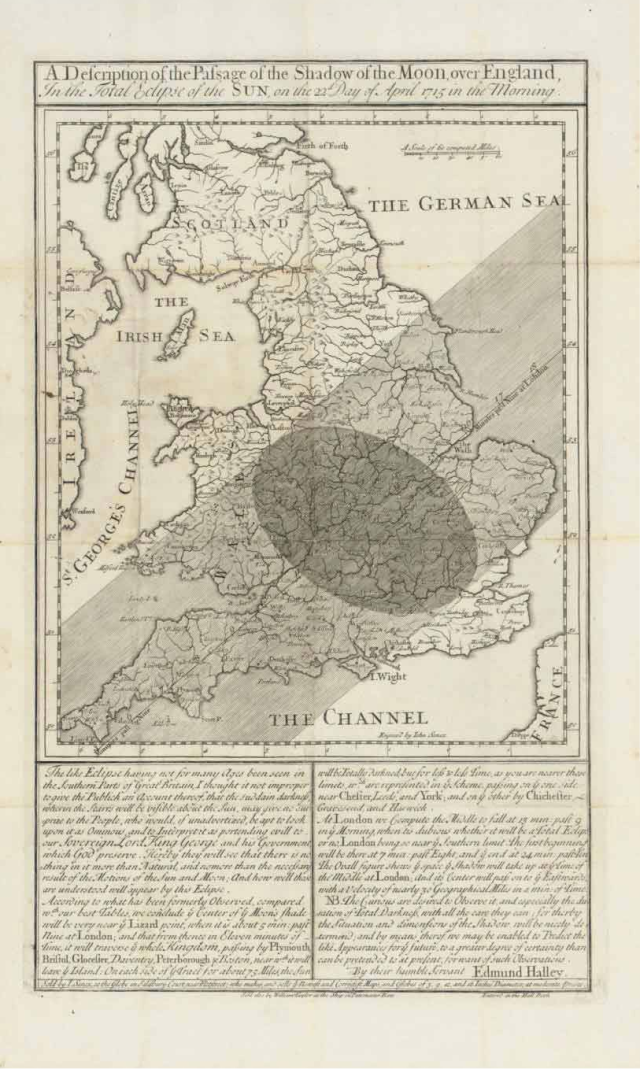
Edmund Halley 1715 eclipse map.
At the bottom, Halley explained his motivation for creating it, noting in an elegant cursive:
The like Eclipse having not for many ages been seen in the Southern Parts of Great Britain, I thought it not improper to give the Publick an Account thereof, that the sudden darkness, wherein the Starrs will be visible about the Sun, may give no surprize to the People, who would, if unadvertized, be apt to look upon it as Ominous, and to interpret it as portending evill to our Sovereign Lord King George and his Government, which God preserve. Hereby they will see that there is nothing in it more than Natural, and no more than the necessary result of the Motions of the Sun and Moon; And how well those are understood will appear by this Eclipse.
Halley’s hope was that people would come to see eclipses as scientific events—moments for exceptional natural observation—rather than supernatural bad omens. For centuries, around the world, total solar eclipses in particular were understood in mythical terms. The ancient Chinese, for example, believed a fire-eating dragon swallowed the sun and medieval European Viking sailors attributed these celestial events to sky wandering wolves catching up with the burning orb.
That started to change in the enlightenment era. But Zeller says that eclipse cartography didn’t really mature until the release of “the first true canon of eclipses,” the Elementa Eclipsium, created in Prague in 1816 by Cassian Hallaschka. The Austro-Hungarian came up with a new theory of eclipse calculation and a comprehensive series of maps that contributed greatly to the day’s cartography.
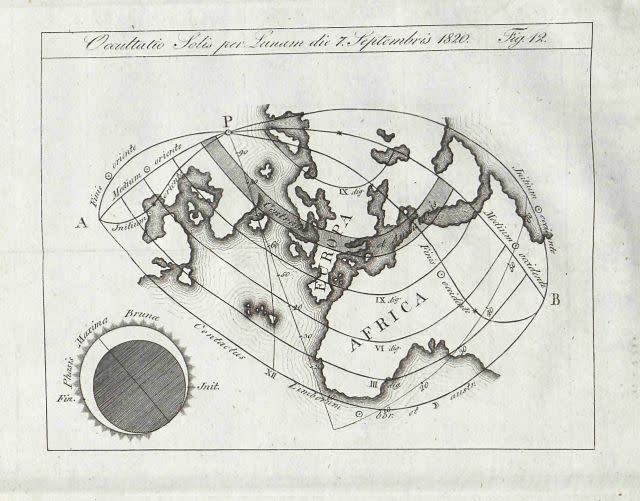
1816 “Elementa Eclipsium” created by Casein Hallaschka in preparation of the eclipse of Sept. 7, 1820.
In the 1840s, star gazers observed that Mercury, when it is closest to the sun, appeared weird, as if it was being tugged by an unseen planet. These observations went on to inform Albert Einstein’s musings: he argued that there was no invisible planet affecting Mercury, but rather that the sun’s gravitational pull was warping where Mercury appeared to be in relation to the glowing orb of light.
The gravitational pull of the sun is so strong, he said, it creates a lensing effect, bending light. That warps the way celestial bodies appear in space-time when they are (relative to our viewing position) close to the sun. This curving accounted for Mercury’s strange behavior near the sun and would be provable during an eclipse, he said.
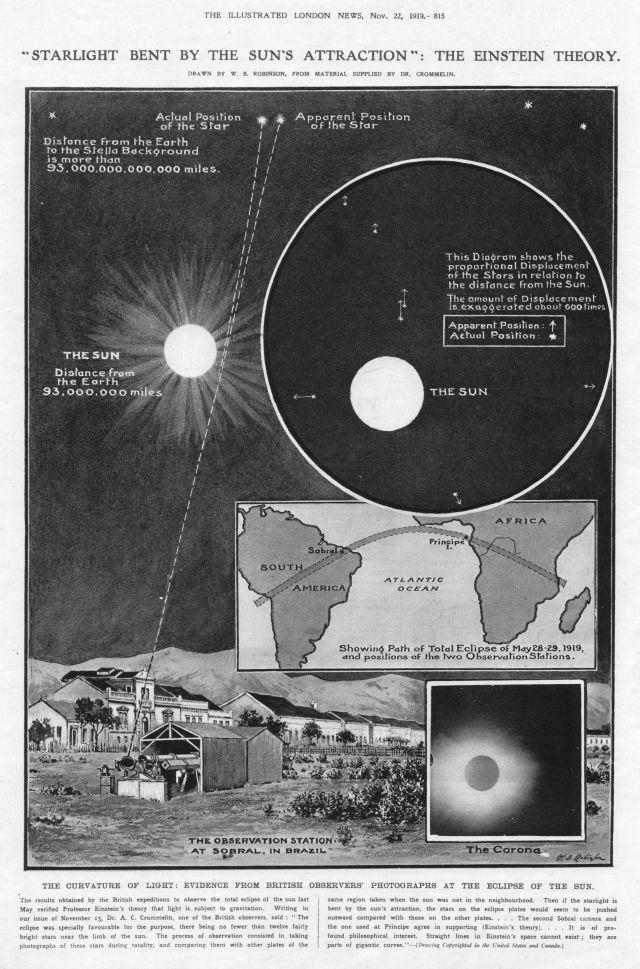
London News article on gravity and light, 1919.
As NASA explains it, “Einstein’s theory of General Relativity predicted that the apparent positions of stars observed near the Sun would be shifted as their light bent through the curved space-time near the massive Sun.” He was proven right in 1919 through experiments undertaken by astrophysicist Arthur Eddington.
Eddington had teams in the path of totality in Brazil and the island of Principe in the Gulf of Guinea photograph and measure star positions relative to the sun during the eclipse. He then compared those measurements to the stars’ catalogued positions six months later, at night, when the sun’s gravitational pull was much less. Eddington noted a difference in the stars’ positions observed during the eclipse compared to those catalogued later. This seemed to confirm Einstein’s theory, making the theoretical physicist a superstar.
Since that time, eclipse maps have evolved quite a bit. In the 1970s, computer generated maps with complicated calculations became the norm in eclipse cartography.
Today a vast array of eclipse maps are created to track different aspects of its passage for scientific purposes, still, interactive, and animated. NASA created this moving map that shows the path of totality of the August total solar eclipse. And there are lots more where that came from.


Sign up for the Quartz Daily Brief, our free daily newsletter with the world’s most important and interesting news.
More stories from Quartz:

