E-mini S&P 500 Index (ES) Futures Technical Analysis – August 3, 2017 Forecast
September E-mini S&P 500 Index futures are trading flat shortly ahead of the cash market opening. There is not a lot to say about this market from a technical perspective. The chart pattern is pretty simple, but we can’t control volume and volatility.
I can tell you that if you didn’t use volume as part of your trading tools before, you may start using it after witnessing the price action the past five session. We’ve nailed the pivot, but without volume and volatility, there is virtually no price action.
I will also tell you that most oscillators and indictors like stochastics and RSI are coincidental indicators. They are probably dragging along while the market moves sideways, but if the index spikes up, they will cross over and give the appearance that they forecast the move. That’s the very definition of a coincidental indicator. It confirms the move after the fact. We’re trying to stay ahead of the market.
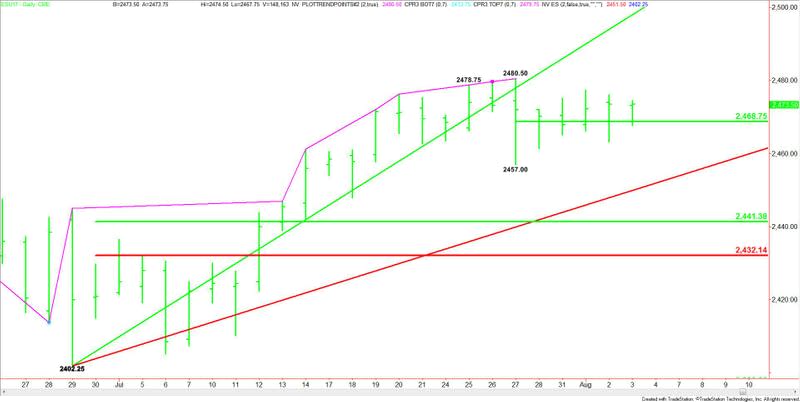
The main trend is up according to the daily swing chart, however, the closing price reversal top on July 27 has killed the momentum.
Taking out 2480.50 will signal a resumption of the uptrend. Taking out 2457.00 will confirm the reversal top and signal a resumption of the selling. Once again volume will tell us if the buying or selling is increasing. These breakout patterns tend to fail if increasing volume isn’t behind the move.
The 50% level or pivot to watch is 2468.75. Holding above this level will give the market an upside bias. A break below it, a downside bias.
On the downside, the first major support angle comes in at 2450.25. This is followed by the major retracement zone at 2441.25 to 2432.00.
The decision for investors at this time is to buy strength or play for a move into a value. The price action suggests they haven’t made up their minds yet.
This article was originally posted on FX Empire
