Does First Sponsor Group Limited's (SGX:ADN) P/E Ratio Signal A Buying Opportunity?

The goal of this article is to teach you how to use price to earnings ratios (P/E ratios). To keep it practical, we'll show how First Sponsor Group Limited's (SGX:ADN) P/E ratio could help you assess the value on offer. What is First Sponsor Group's P/E ratio? Well, based on the last twelve months it is 7.65. That corresponds to an earnings yield of approximately 13%.
See our latest analysis for First Sponsor Group
How Do You Calculate A P/E Ratio?
The formula for price to earnings is:
Price to Earnings Ratio = Share Price ÷ Earnings per Share (EPS)
Or for First Sponsor Group:
P/E of 7.65 = SGD1.28 ÷ SGD0.17 (Based on the trailing twelve months to December 2018.)
Is A High P/E Ratio Good?
A higher P/E ratio means that buyers have to pay a higher price for each SGD1 the company has earned over the last year. That isn't necessarily good or bad, but a high P/E implies relatively high expectations of what a company can achieve in the future.
How Growth Rates Impact P/E Ratios
Probably the most important factor in determining what P/E a company trades on is the earnings growth. That's because companies that grow earnings per share quickly will rapidly increase the 'E' in the equation. Therefore, even if you pay a high multiple of earnings now, that multiple will become lower in the future. And as that P/E ratio drops, the company will look cheap, unless its share price increases.
It's great to see that First Sponsor Group grew EPS by 23% in the last year. And its annual EPS growth rate over 5 years is 2.2%. So one might expect an above average P/E ratio.
Does First Sponsor Group Have A Relatively High Or Low P/E For Its Industry?
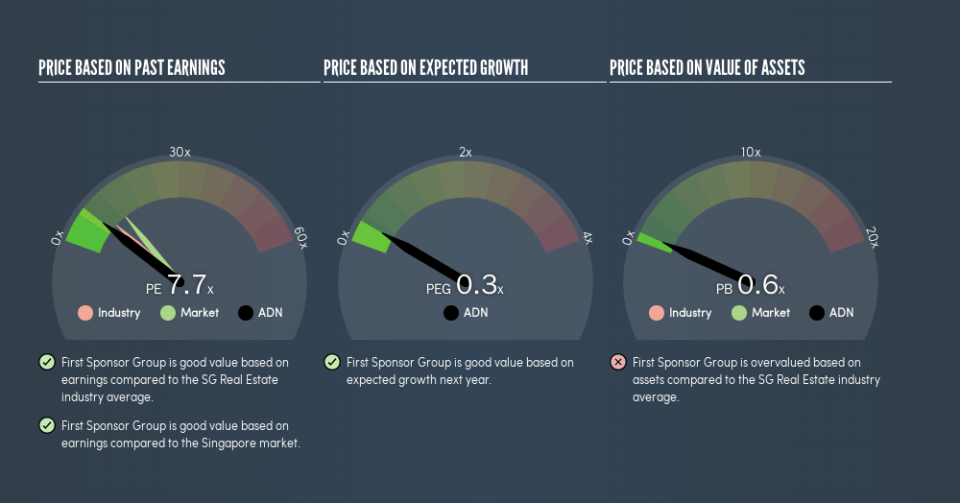
The P/E ratio essentially measures market expectations of a company. We can see in the image below that the average P/E (9.5) for companies in the real estate industry is higher than First Sponsor Group's P/E.
Its relatively low P/E ratio indicates that First Sponsor Group shareholders think it will struggle to do as well as other companies in its industry classification. Many investors like to buy stocks when the market is pessimistic about their prospects. You should delve deeper. I like to check if company insiders have been buying or selling.
Remember: P/E Ratios Don't Consider The Balance Sheet
One drawback of using a P/E ratio is that it considers market capitalization, but not the balance sheet. Thus, the metric does not reflect cash or debt held by the company. Hypothetically, a company could reduce its future P/E ratio by spending its cash (or taking on debt) to achieve higher earnings.
Spending on growth might be good or bad a few years later, but the point is that the P/E ratio does not account for the option (or lack thereof).
First Sponsor Group's Balance Sheet
First Sponsor Group's net debt is 53% of its market cap. This is enough debt that you'd have to make some adjustments before using the P/E ratio to compare it to a company with net cash.
The Verdict On First Sponsor Group's P/E Ratio
First Sponsor Group has a P/E of 7.7. That's below the average in the SG market, which is 13.1. The company has a meaningful amount of debt on the balance sheet, but that should not eclipse the solid earnings growth. If the company can continue to grow earnings, then the current P/E may be unjustifiably low.
Investors have an opportunity when market expectations about a stock are wrong. If it is underestimating a company, investors can make money by buying and holding the shares until the market corrects itself. So this free visual report on analyst forecasts could hold the key to an excellent investment decision.
You might be able to find a better buy than First Sponsor Group. If you want a selection of possible winners, check out this free list of interesting companies that trade on a P/E below 20 (but have proven they can grow earnings).
We aim to bring you long-term focused research analysis driven by fundamental data. Note that our analysis may not factor in the latest price-sensitive company announcements or qualitative material.
If you spot an error that warrants correction, please contact the editor at editorial-team@simplywallst.com. This article by Simply Wall St is general in nature. It does not constitute a recommendation to buy or sell any stock, and does not take account of your objectives, or your financial situation. Simply Wall St has no position in the stocks mentioned. Thank you for reading.

