Despite wet winter, most SLO County spots are still short of seasonal rainfall averages
Entering into the last month of the rainy season, most areas of San Luis Obispo County are a little short of average annual rainfall totals, despite yet another winter characterized by storms.
That doesn’t necessarily mean the region will plunge into a drought, however — especially since this year’s about-average rainfall year follows a year of incredible precipitation that refilled reservoirs and overflowed creeks.
Data from the San Luis Obispo County Public Works Department show that most areas of the county have received between 70% to 98% of their annual average. The county calculates annual rainfall for the rainy season starting on July 1 and running through June 30.
San Luis Obispo County’s rainiest months are typically December through March, so there’s a chance that areas of the county that haven’t yet reached 100% of their average annual rainfall totals could still catch up.
There are some areas, such as Rocky Butte in the mountains northeast of Cambria, Davis Peak northeast of Diablo Canyon nuclear power plant and Nipomo, that have already seen 100% or more of their average annual rainfall amounts, according to the county’s data.
The about-average rainy season was coupled with a warmer-than-normal winter, according to the National Centers for Environmental Information, an arm of the National Oceanic and Atmospheric Administration.
The average temperature in San Luis Obispo County was about 51 degrees in December and January, according to NOAA’s data which goes back to 1896. That’s roughly 4 degrees warmer than the historical average for those two months and was the fifth-warmest ever recorded for the months, NOAA’s data show.
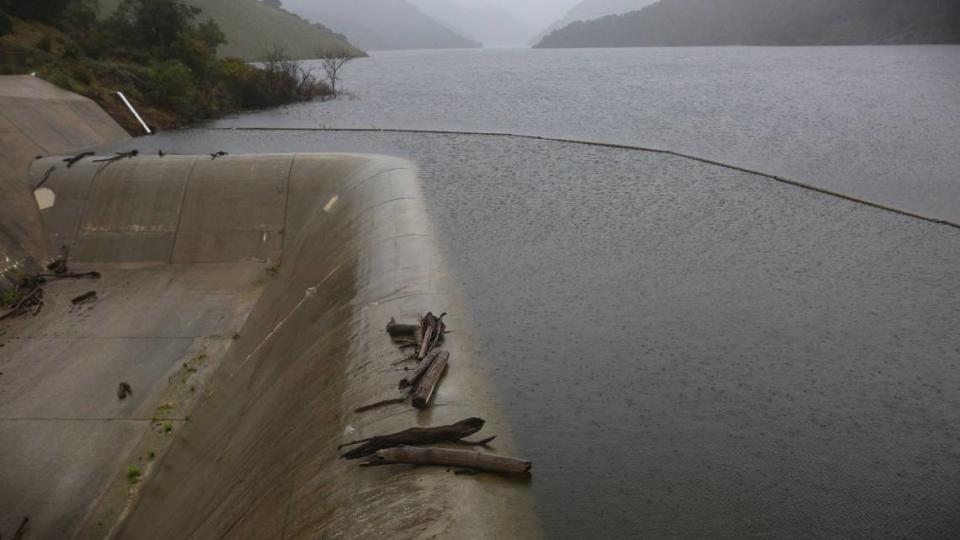
Almost all of the reservoirs in San Luis Obispo County are spilling after this season’s rainfall to date.
Santa Margarita Lake started spilling on Feb. 5, followed two days later by Lopez Lake. Whale Rock Reservoir near Cayucos began spilling on Feb. 19, while Lake Nacimiento was at 92% capacity as of Thursday.
2022-23 much rainier because of massive atmospheric river storms
This year’s rainfall totals come in sharp contrast to last year’s totals by this time.
For example, the San Luis Obispo Reservoir located along Highway 101 at the southern base of the Grade received 18.39 inches of rain since July 1, according to the county public works department. That’s 77% of that gauge’s annual average.
This same time last year, the San Luis Obispo Reservoir had received 37.74 inches of rain — about 157% of the gauge’s annual average, according to the data.
That astronomical rainfall total rose to 52.16 inches, 217% of the annual average, by the end of March 2023.
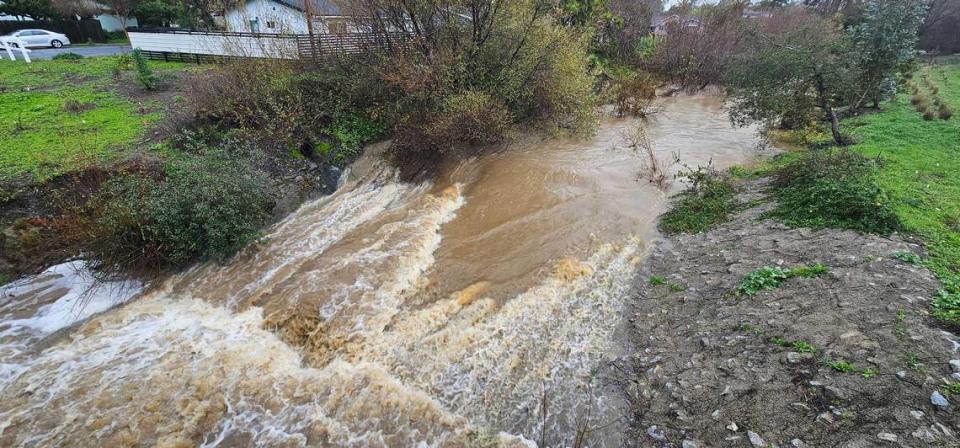
A similar trend perpetuated around San Luis Obispo County because of the massive atmospheric river storms that slammed into the Central Coast last year.
Those storms in January and March caused catastrophic infrastructure fails across the county which led to homes, businesses and roads being flooded and two deaths.
This year’s SLO County rainfall totals to date
Although the rainiest months of the current season are over, San Luis Obispo County has often received plenty of rainfall in March and sometimes even in April.
Here’s where the season-to-date totals are so far for the county, according to the San Luis Obispo County Public Works’ data:
Rocky Butte: 61.26 inches, 153% of normal
Davis Peak: 20.92 inches, 116% of normal
Lopez Lake: 21.33 inches, 107% of normal
East Nipomo: 18.35 inches, 102% of normal
South Nipomo: 14.02 inches, 100% of normal
Santa Margarita Lake: 21.79 inches, 99% of normal
Creston: 11.78 inches, 98% of normal
Los Osos Landfill: 17.38 inches, 97% of normal
Camp San Luis: 19.27 inches, 96% of normal
Midway along Highway 41 between Morro Bay and Atascadero: 25.69 inches, 92% of normal
Cambria: 19.9 inches, 90% of normal
Arroyo Grande: 15.6 inches, 87% of normal
Shandon: 10.37 inches, 86% of normal
South Portal in Stenner Springs Open Space: 24.1 inches, 86% of normal
Oceano: 13.43 inches, 84% of normal
Hog Canyon east of Camp Roberts: 13.3 inches, 83% of normal
Templeton: 14.42 inches, 80% of normal
San Luis Obispo off Industrial Way and Broad Street: 17.25 inches, 78% of normal
Santa Margarita: 18.47 inches, 77% of normal
San Luis Obispo Reservoir: 18.39 inches, 77% of normal
San Simeon: 18.32 inches, 76% of normal
Atascadero: 12.53 inches, 70% of normal
Highway 46 near Arroyo del Mar Road: 18.37 inches, 61% of normal

