A Deep Look at Financial Strength Scores for Top Sports Apparel Companies
- By James Li
In light of an exciting 2017 association football season, several sports apparel companies are stepping up their game, including Nike Inc. (NKE), adidas AG (ADS)(ADS1.F), Sketchers Inc. (SKX), Puma SE (XTER:PUM) and Under Armour Inc. (UA)(UAA). These companies are fiercely competing amongst themselves as they strive to attract customers with innovative products. To determine which of these companies has the strongest value potential, we can compare the companies' three financial strength scores: the Piotroski F-score, the Altman Z-score and the Beneish M-score.
Warning! GuruFocus has detected 3 Warning Sign with TITN. Click here to check it out.
The intrinsic value of NKE
Nike
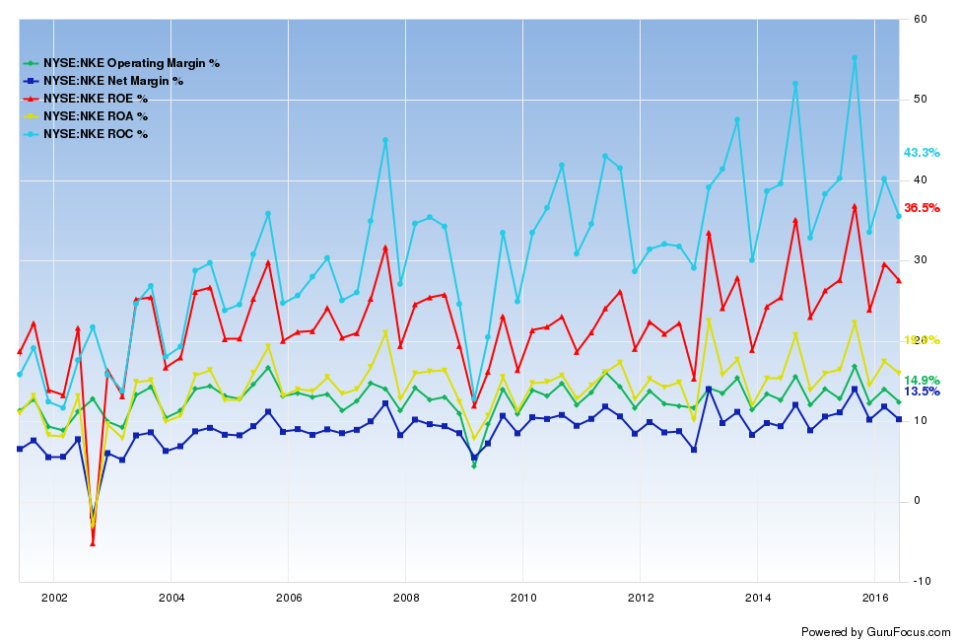
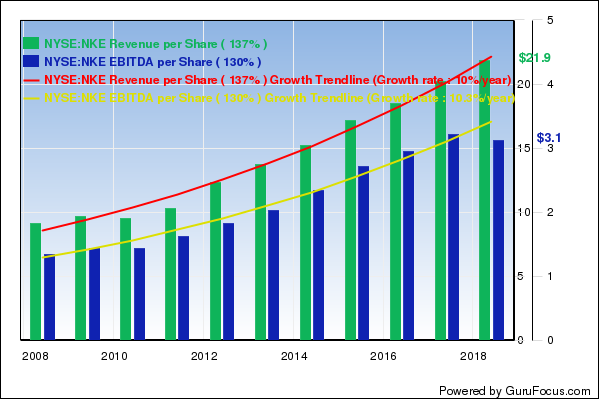
As mentioned in a previous article, Nike offers a strong competitive edge due to high profitability and business predictability. The Oregon-based sports giant currently has five good signs, including expanding operating margins and consistent per-share revenue growth. Additionally, Nike's margins and returns are near a 10-year high and outperform over 85% of global footwear and accessories companies.
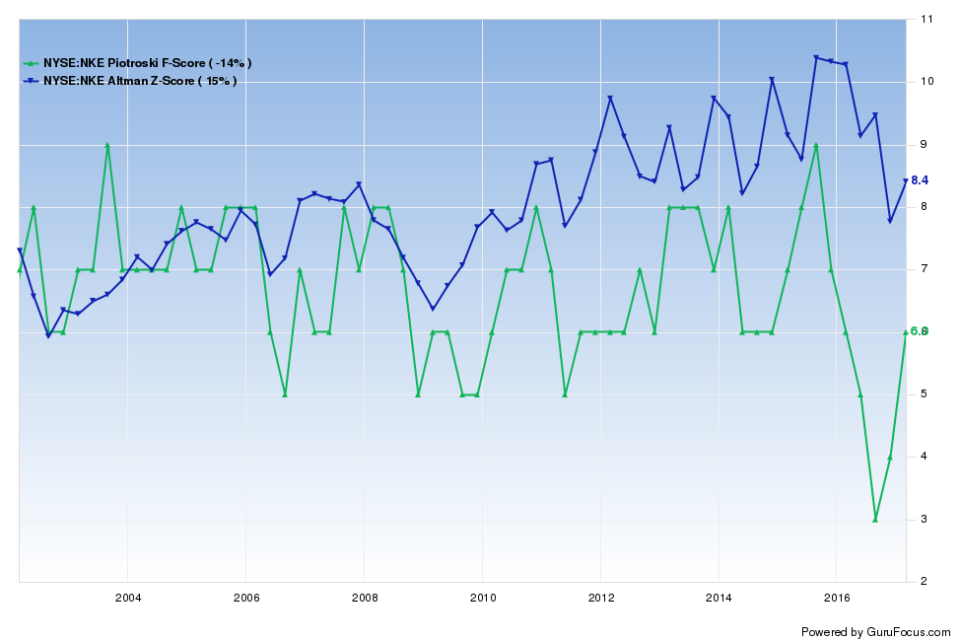
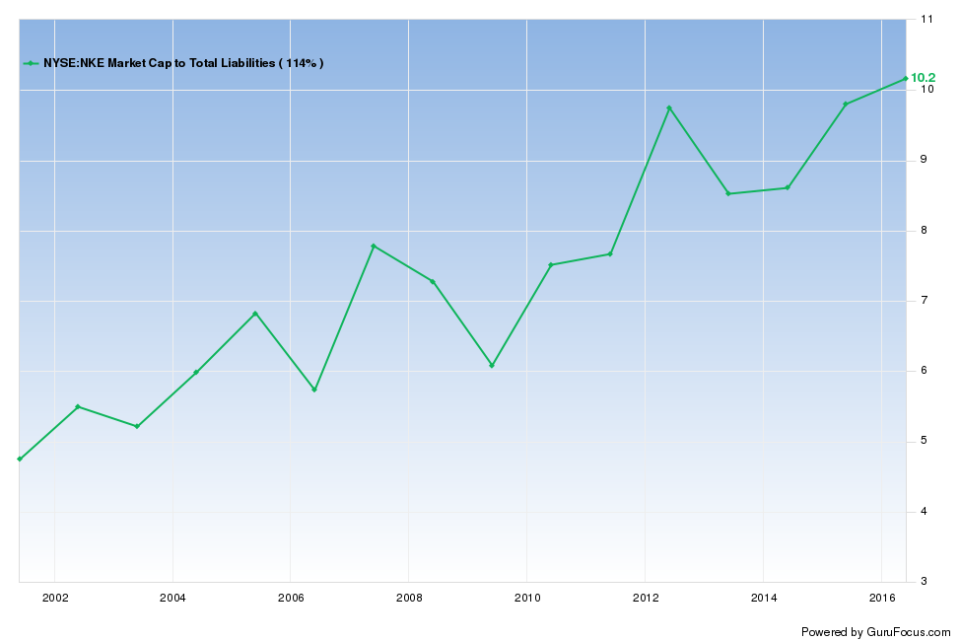
Despite having a moderately strong F-score, Nike's Z-score of 8.26 suggests almost no financial distress. Over the past 15 years, Nike's Z-score has gradually increased from about 6 to a maximum of 10, significantly above the safe threshold of 2.99. The Z-scores are driven by high market cap to liabilities ratios, which have seldom dropped below 8 since 2010.
Nike's management reiterated its strong third-quarter earnings performance in the quarterly report filing with the Securities and Exchange Commission. Higher revenue growth in the Sportswear and Jordan Brand categories more than offset sales declines in the other categories, resulting in an 8% revenue growth for the nine months ending February 2017. In the earnings call, CEO Mark Parker reiterated the company's "Triple Double" strategy, which includes doubling the revenue growth impacts from three core areas: "the innovation that inspires them, the supply chain that delivers it quickly and in the marketplace where [Nike] connects personally with consumers." Nike's strong competitive approach allowed the company to maintain a GuruFocus business predictability rank of four stars throughout 2016 and 2017.
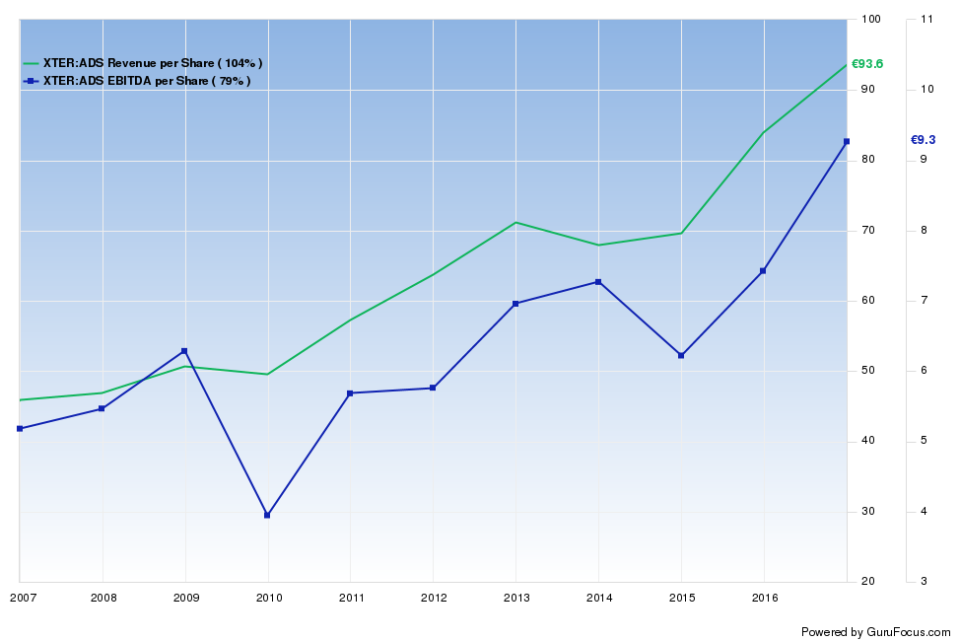
Adidas
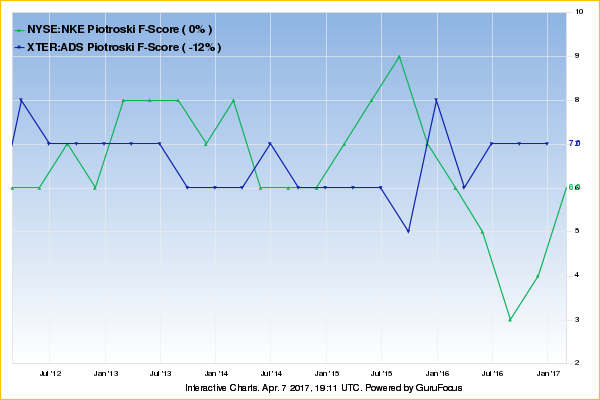
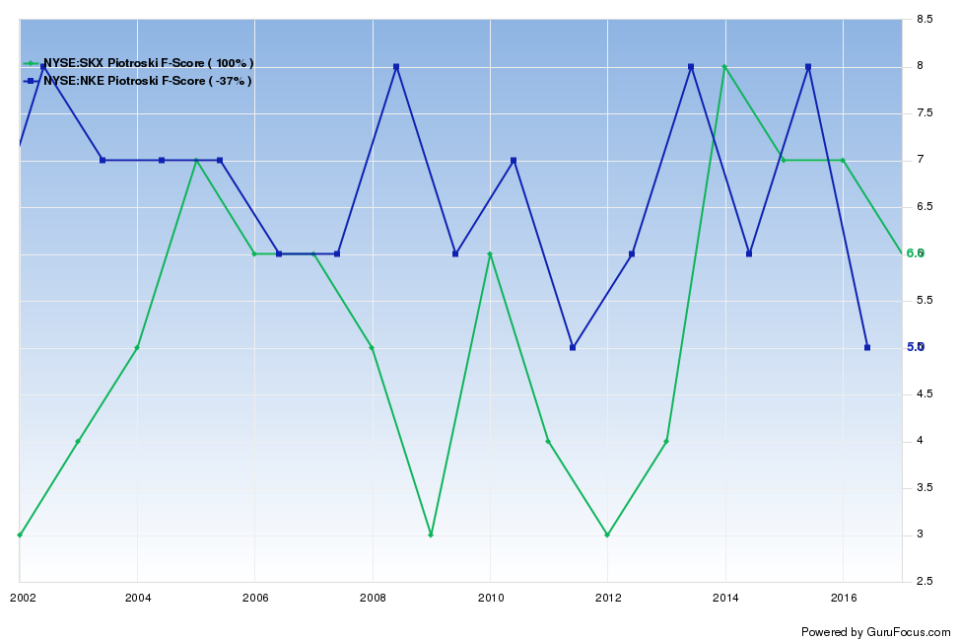
One of Nike's major competitors, Germany-based Adidas, also has solid financial strength and profitability. While it has weaker Altman Z-scores, Adidas currently has a Piotroski F-score of 7, one rank higher than Nike's. Unlike Nike, whose Piotroski F-score dropped from 9 to 3 from August 2015 to August 2016, Adidas had more stable F-scores during the past five years.
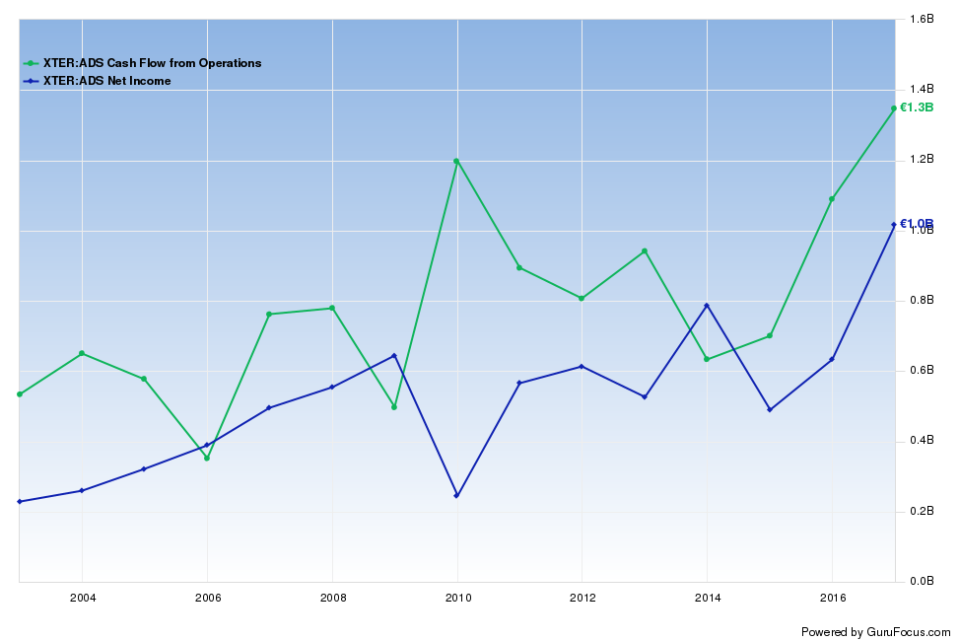
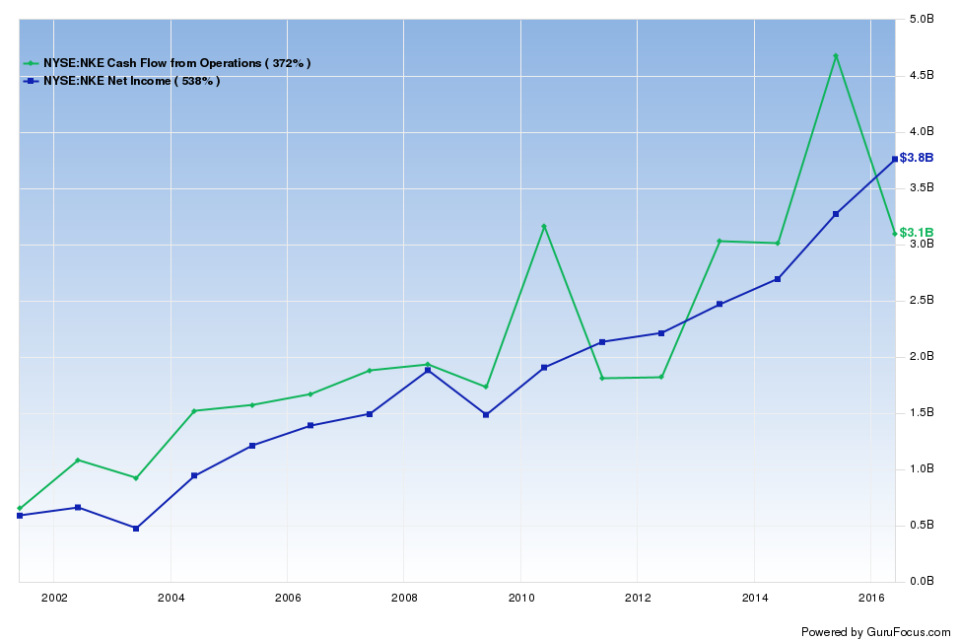
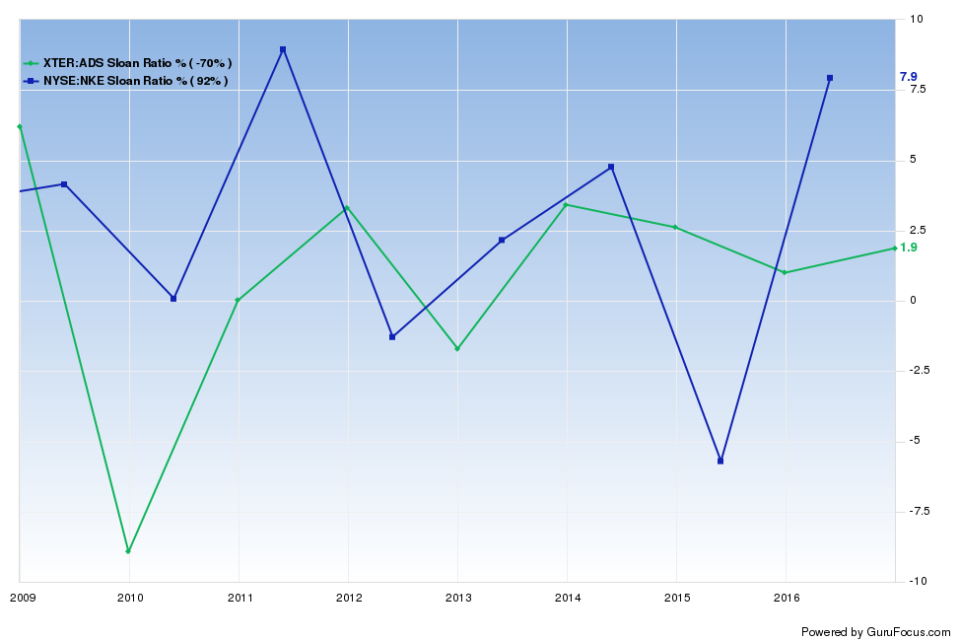
Two of Joseph Piotroski's criteria include "quality of earnings" and "change in gross margin." The former compares the company's cash flow return on assets to the standard return on assets, and scores 1 if the cash flow ROA outperforms the standard ROA (and 0 otherwise). A similar ratio that captures earnings quality is the Sloan ratio: the closer this ratio is to zero, the more pristine (i.e., free of accruals) the company's earnings. Adidas consistently had higher operating cash flow relative to net income over the past 15 years. On the other hand, Nike's net income is currently about $0.7 billion higher than its operating cash flow.
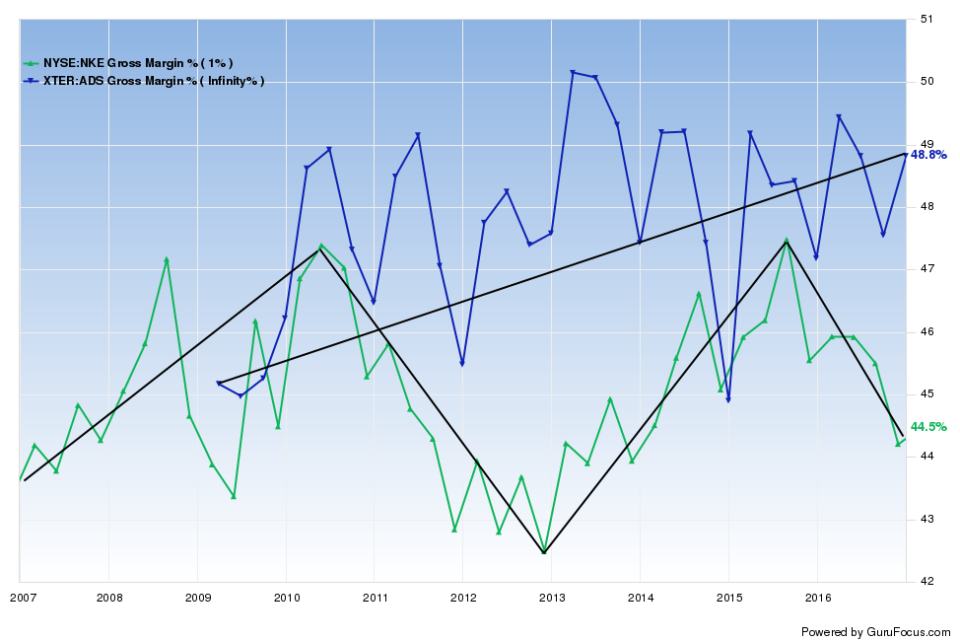
Berkshire Hathaway Inc. (BRK.A) (BRK-B) CEO Warren Buffett (Trades, Portfolio) lists "durable competitive advantage" as one of four key criteria in his investing approach. We can analyze a company's gross margin throughout the past 10 to 15 years to measure how strong a company's "moat" is compared to its competitors. Piotroski takes this further by comparing the year-over-year change in the company's gross margin. Companies score one point if the current gross margin outperforms the prior-year's gross margin and zero otherwise. While Adidas' gross margin generally increased over the past 10 years, Nike's gross margin first increased for about three years and then decreased for about three years.
Although it has stronger financial strength scores, Adidas has a predictability rank of a meager 2.5 stars. The German company had declining EBITDA per share during 2009-2010 and 2014-2015. On the other hand, Nike had more consistent EBITDA growth than Adidas did, resulting in a four-star predictability rank.
Sketchers
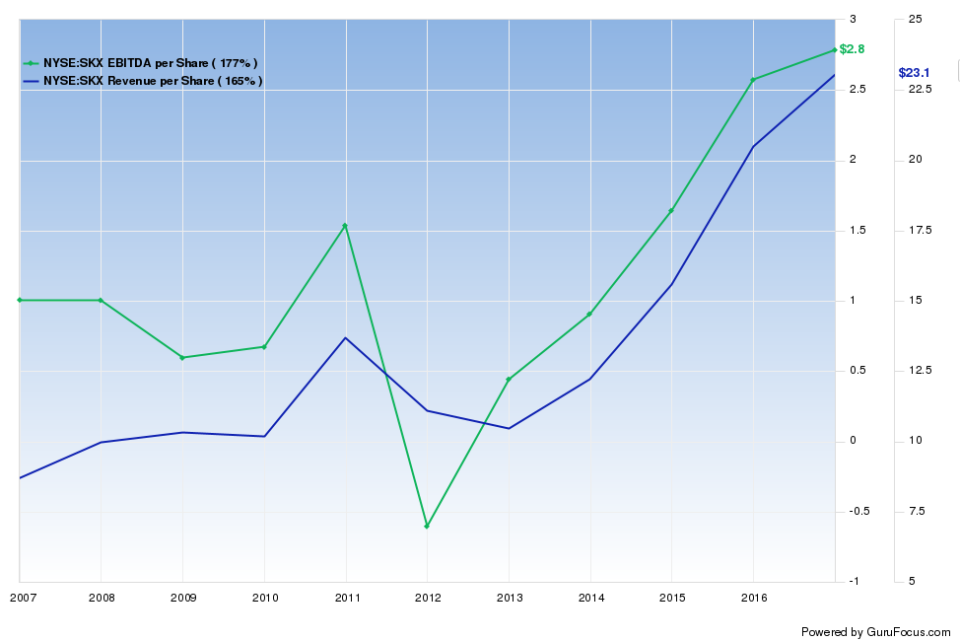
California-based Sketchers offers an eclectic variety of footwear: Not only does the company design sportswear, Sketchers also markets "trendy casual" footwear for everyday life. As discussed in its latest annual report filing, Sketchers generates revenue growth through brand recognition, aggressively marketing the brand for all age groups and gender types. The company's diversified product lines allow Sketchers to exhibit high profitability even in an industry dominated by Nike and Adidas.
Although Sketchers has margins and returns close to a 10-year high, the company's operating margin and return on equity outperform just 75% of competitors. Despite having similar F-scores as Nike, Sketchers has stronger financial strength, with comfortable interest coverage and approximately $9.58 in cash per $1 in debt.
Unfortunately for Sketchers, the company has a one-star predictability rank as its EBITDA per share dropped to -0.6 for fiscal year 2011. Companies that had operating loss during the past 10 years generally receive a one-star predictability rank, indicating they have unpredictable earnings.
Puma and Under Armour: potential value traps?
While Nike and Adidas dominate the sports apparel industry, companies that fall behind can lose their competitive power. Germany and the U.S. both feature a potential value trap in the sports apparel industry: Puma and Under Armour.
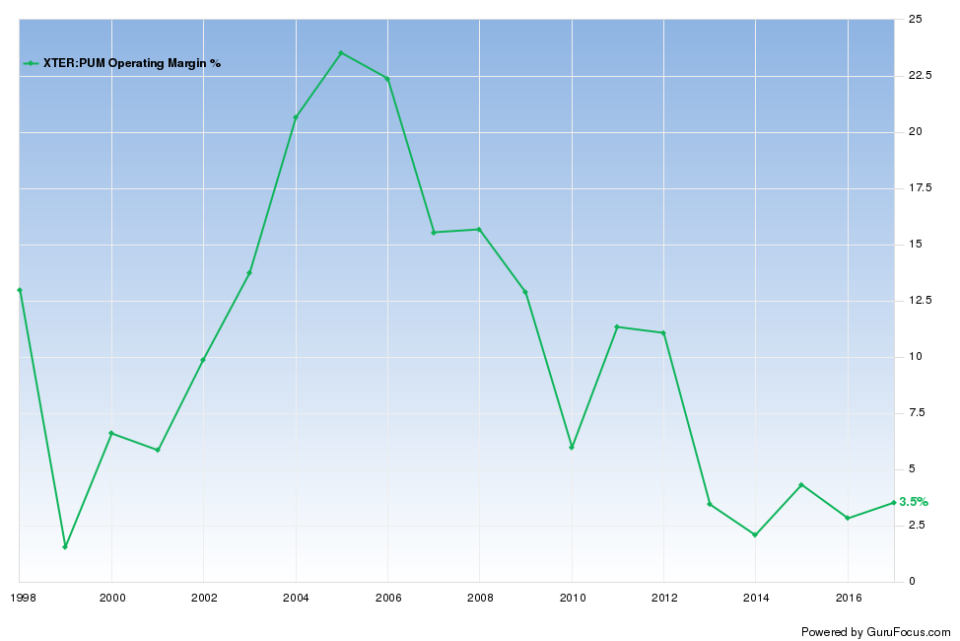
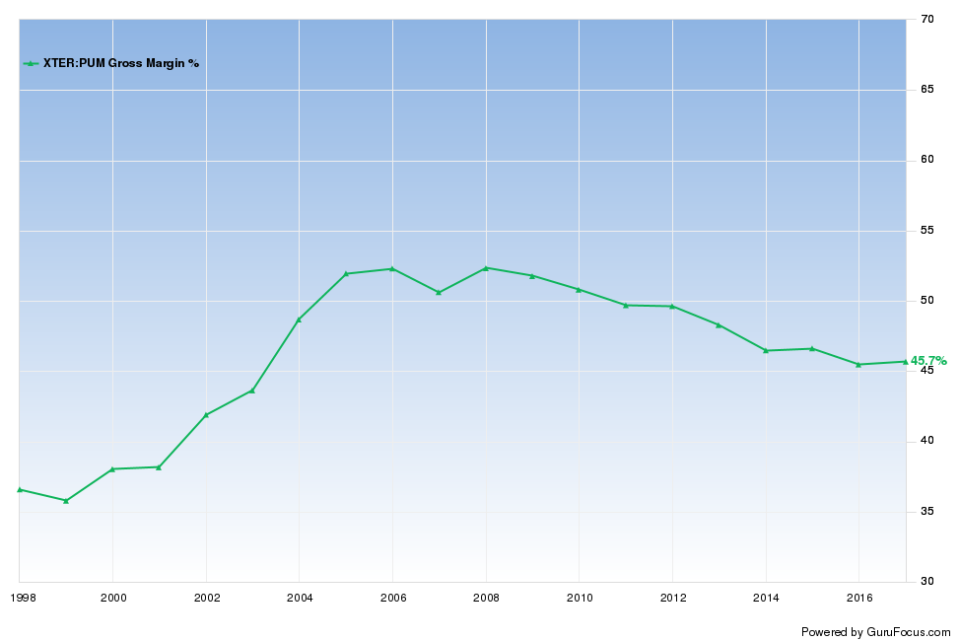
Although Puma has a financial strength of 8 and profitability of 6, its profit margins are near a 10-year low. The company's operating margin and return on equity underperform 60% and 62% of companies, respectively, suggesting declining growth potential. Worse, Puma's operating margin and gross margin has declined approximately 14.8% per year and 1.7% per year, respectively, over the past five years.
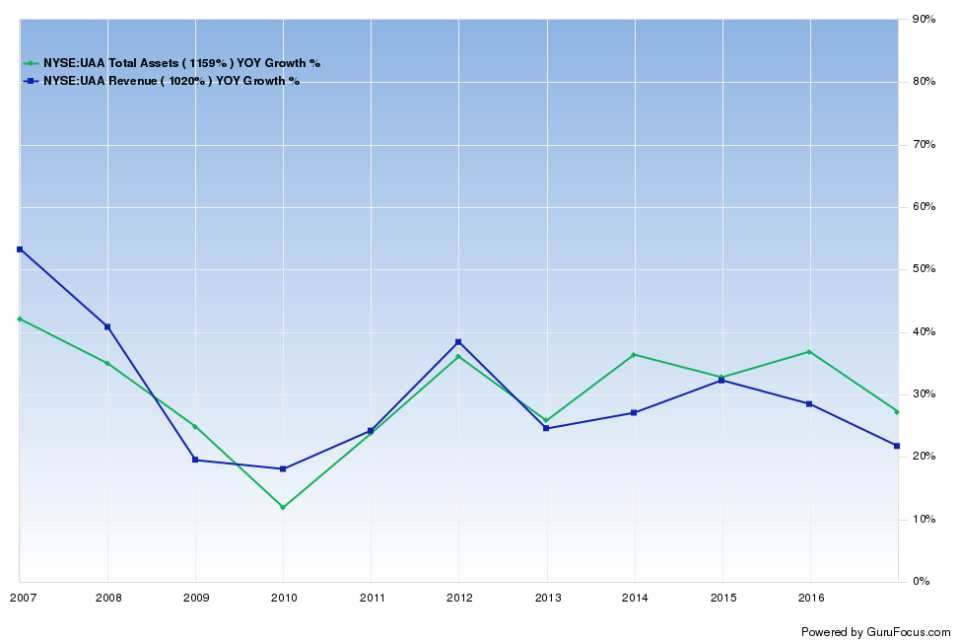
Under Armour has the worst Piotroski F-score among the companies, with scores seldom exceeding 3 during the past 12 quarters. The company has three severe warning signs, including contracting operating margins and high asset growth compared to revenue growth. Such financial characteristics make Under Armour a potential short-sell candidate based on James Montier's screen.

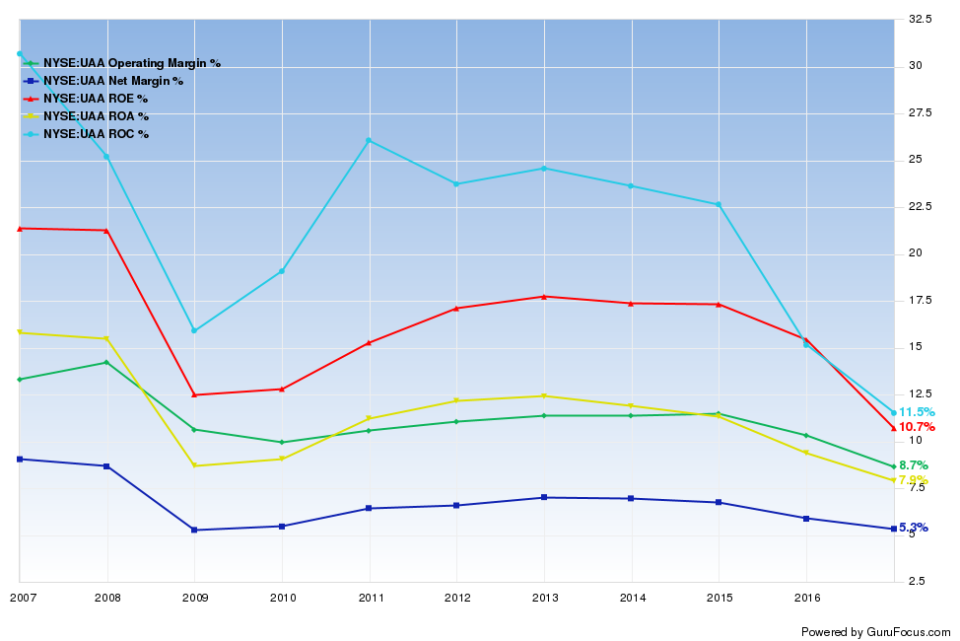
Under Armour's management gave a weak 2017 earnings outlook in its 2016 annual report filing: the company expects operating income to decline due to several potential challenges, including the "disruption of the North American retail environment" and the inability to adapt to customers in a timely manner. Additionally, competitive pressures from Nike and Adidas can lower the price of Under Armour's products, reducing its profitability.
Conclusions
As sports apparel companies operate in a cyclical industry, market expansions and contractions can significantly impact the revenue and earnings growth of these companies. Thus, the Buffett-Munger strategy can help limit losses when investing in these companies. With strong profitability and predictability, Nike offers the highest growth and value potential among these companies. Adidas and Sketchers make good alternatives due to solid competitive power as well.
Disclosure: The author has no position in the stocks mentioned in this article.
Start a free 7-day trial of Premium Membership to GuruFocus.
This article first appeared on GuruFocus.
Warning! GuruFocus has detected 3 Warning Sign with TITN. Click here to check it out.
The intrinsic value of NKE
