Crude Oil Price Forecast: Positioning & Volatility Favors Bulls
DailyFX.com -
Talking Points:
Crude Oil Technical Strategy: Major Moving Average Crossover Could Usher In Next Rally
Volaitlity At 15-Month Lows & Bearish Positions Evaporating Favors Upside
Oil Price Under Pressure on Output Worries, Hedge Funds Dump Gold
The price of Crude Oil has continued to remain above the key daily support levels of October 10 of $49.17/bbl (Bullish Key Day), and October 13 of $49.34/bbl. So far, the price looks to be consolidating sideways that may favor a strong move higher could be the result as positioning gets set. We’re still a month away from the Vienna meeting where traders are hoping for a confirmation of a production cut from ~33 million barrels per day from OPEC to ~32.5 million barrels per day.
Interested In a Quick Guide about OPEC, Click Here
Two positive notes that we alluded to in the title is the near capitulation of bearish positions, and the low volatility environment we see in crude Oil. Volatility has fallen to 15-month lows in both Brent & WTI front-end andsecond-month implied volatility. Low volatility in financial markets tends to favor stable moves higher.
Secondly, the number of hedge funds that are bearish Oil have dropped aggressively after the OPEC deal per the CFTC’s Commitment of Trader’s report. The net positioning is now the most bullish since 2014 as the aggregate bearish WTI bets have fallen over 50% in the last three weeks. This drop in bearish positioning has removed a major headwind for Oil, and any strong move higher will likely have fewer participants fighting and more joining.
Access Free Oil Trading Guide from DailyFX Analysts HERE!
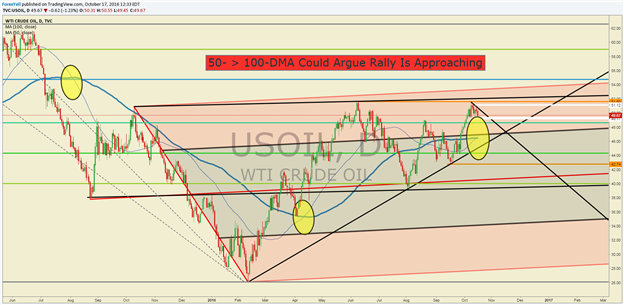
Daily Crude Oil Price Chart: 50-DMA > 100-DMA Keeps Bulls Awaiting Head & Shoulder’s Breakout
Chart Created by Tyler Yell, CMT. Courtesy of TradingView
We have long been a proponent of a Bullish or Reverse head and shoulder pattern in Crude Oil that we discussed in our Q4 Oil Forecast. The Bullish pattern could take the once-battered commodity as high as $78/bbl.
The chart above shows a key technical development has occurred that tends to portray the path of least resistance. The development is that the 50-DMA (~2.5 Months of trading) has crossed above the 100-DMA (~5 months of trading data). You can see the highlighted circle showing when the 50-DMA has crossed above or below the 100-DMA, which has proceeded a strong trending move.
Monday’s bullish crossover could be the technical nail in the bearish coffin before we get the Bullish Head & Shoulder’s breakout above ~$52/bbl. For now, a break below the October 10thlow would turn us short-term neutral with the probability favoring a larger breakdown toward the 50-DMA near $46.50 before aligning with the longer-term bullish bias.
Key Levels Over the Next 48-hrs of Trading As of Monday, October 17,2016
T.Y.
To receive Tyler’s analysis directly via email, please SIGN UP HERE
DailyFX provides forex news and technical analysis on the trends that influence the global currency markets.
Learn forex trading with a free practice account and trading charts from FXCM.


