Commodity Technical Analysis: Gold Structural and Measured Resistance into 1750
Daily Bars
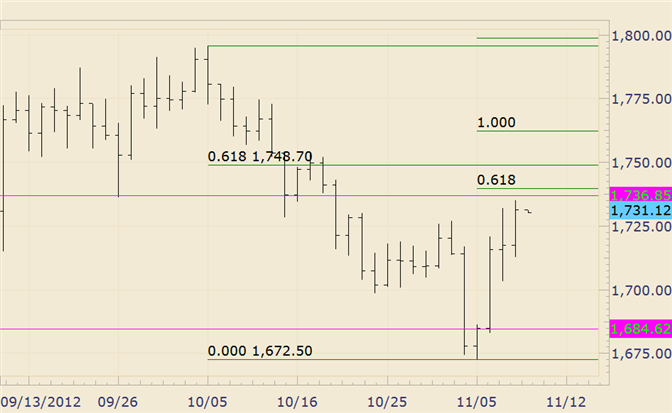
Chart Prepared by Jamie Saettele, CMT
Commodity Observations: Gold extended gains just above structural resistance and is nearing resistance from measured levels at 1740, 1749, and 1762. The latter level is where the rally from the low would consist of 2 equal legs.1780 can’t be ruled out either.
Commodity Trading Strategy Implications: I’m on the lookout for a wave 2 or B top below the October high.
LEVELS: 1685 1703 1712 1749 1762 1780
DailyFX provides forex news and technical analysis on the trends that influence the global currency markets.
Learn forex trading with a free practice account and trading charts from FXCM.

