Coca-Cola: Buy at $38 or if Sales Growth Tops 3.5%
- By Daniel Seens
Demographic shifts, changing consumer preferences and dietary trends have led us to re-evaluate the strength of Coca-Cola's (KO) competitive advantage. Putting it in simplest terms, today's consumer group is far more health conscious than ever before, and this is hurting the company's bottom line. Millennials want healthier, more unique and sometimes more refined food and drink options - and Coca-Cola is taking its sweet time getting into the game.
Warning! GuruFocus has detected 5 Warning Sign with KO. Click here to check it out.
The intrinsic value of KO
Coke won the "Pepsi (PEP) vs. Coke" challenge a long time ago. This was an easy win as Coke has become synonymous with cola flavoured soda drinks. Despite this fact, however, it certainly doesn't make Coca-Cola a more valuable company or a better stock investment than Pepsi. Pepsi is actually a more diversified company than Coca-Cola with its Frito-Lay food business and has put in some more robust growth numbers over the last few years.
That said, we don't think that Coca-Cola is just going to lay down and accept mediocrity. Coca-Cola is a winner, bottom line! It has some of the best drink brands in the world. It has an enormous distribution channel and international presence - and a few initiatives and acquisition targets that we think will help the company keep advancing over the next couple of decades.
The company
Coca-Cola is the world's largest beverage company. For more than 100 years, the company has produced concentrates and syrups, which it then bottles or cans itself or sells to independent bottlers worldwide.
In an effort to support margins across the supply chain, Coca-Cola took steps in 2010 to acquire bottler Coca-Cola Enterprises' North American operations, with distribution across Europe still handled by Coca-Cola European Partners (CCE). The primary function of bottlers is to add water, carbonation, sugar, Coca-Cola 's concentrates and any other ingredients and then bottle the liquid for distribution. Its drinks are sold primarily to restaurants, retailers and other distributors.
Coca-Cola owns all of its drink brands and is responsible for marketing initiatives.
The company operates in more than 200 countries and markets nearly 500 brands of concentrate and finished drinks. Coca-Cola 's concentrates are used to produce more than 3,500 different branded products including Coca-Cola. The company continues to strive to expand its beverage line beyond traditional soda drinks. Major brands within Coca-Cola's portfolio include Minute Maid and Simply Orange juices, Dasani and Evian bottled waters, Powerade and Full Throttle sports beverages, Nestea and Gold Peak Tea and FUZE iced teas, Glaceau vitamin waters, Ayataka Green Tea, I Lohas water in Japan and Del Valle in Latin America. The total numbers are mind blowing: 3,500 products, 500 brands, 20 of which have reached $1 billion in sales, 28.2 billion cases worldwide, which equates to over 635 billion servings per year, 1.9 billion beverages consumed per day, and 21,990 servings per second, all processed through more than 250 bottlers serving 200 countries, and all handled through the world's largest beverage distribution system.
In terms of unit case volume, 79% of all sales are overseas - 29% in Latin America, 15% in Eurasia/ Africa, 21% in the Pacific and 14% in Europe. In revenue terms, the company reports about 57% as overseas sales.
2016 financial highlights
Net revenues were $41.9 billion for the full year, a 5% decline from the prior year, impacted by foreign currency losses of 3% and higher than expected costs associated with headwinds from acquisitions, divestitures, and structural items. Organic revenues (non-GAAP) for the full year grew 3%, driven by price-mix growth of 3%.
Coca-Cola gained global value share in total nonalcoholic ready-to-drink beverages and sparkling beverages markets.
Total unit case volume grew 1% for the full year.
For the full year, sales to developed markets grew low single digits while its emerging and developing markets were even.
Operating margins for the full year expanded more than 90 basis points. Improvements over 2015 were driven by continued extensions of its pricing initiatives, a slightly favorable cost environment and productivity gains.
2017 management guidance
For 2017, management expects:
3% organic revenue growth.
7% to 8% growth in comparable currency neutral income before taxes driven by strong operating performance partially offset by an increasing interest rate environment.
Net share repurchases (non-GAAP): Approximately $2.0 billion.
Net capital expenditures: $2.0 billion to $2.5 billion.
Full Year 2017 EPS decline of 1% to 4%.
Qualitative considerations
With any investment, we like a sure thing. If Warren Buffett (Trades, Portfolio) would never sell his stock in this company, it's probably at least worth considering for your own portfolio.
The reasons to hold Coke remain solid and its competitive advantage remains well intact despite challenges in recent years to revitalize sales. The company has category leadership, especially globally, in soft drinks, juices and juice drinks and ready-to-drink coffees and teas. It is No. 2 globally in sports drinks and No. 3 in packaged water and energy drinks. Coca-Cola, Diet Coke, Sprite and Fanta represent four of the top five brands of soft drink in the world. The Coca-Cola name is probably the most recognized brand in the world and is firmly engrained in the minds of consumers. Virtually no company will overtake this company's leadership position in the beverage market.
While in our opinion Coke was slow to respond to changing consumer preference and health trends, the company is figuring it out and has learned its lesson. We think the company is going to represent a major acquirer over the next decade. We think it was a great move buying about 16% interest in "K-cup" single-serving beverage maker and marketer Keurig Green Mountain (GMCR) in 2013.
Its 17% purchase of beverage maker Monster Beverage (MNST) was another good move, and now there are other rumors swirling about buying a few plant-based food and beverage makers. This company has a lot of cash to burn and has proven to be an effective acquirer. Additionally, we like recent product innovations as it relates to customizable fountain machines in fast-food restaurants that allow drinkers to combine drink flavors. Mass customization of can and bottle labels is another fun way Coke is attempting to reach consumers, all positive moves in our opinion.
Coke is a good hedge for most investors' portfolios. It offers a solid dividend with a strong track record of growth. The company has raised its dividend every year for more than 50 years and has returned over $10 billion in cash to shareholders since 2013. Finally, revenues are globally diversified, and the company has a low beta of 0.7.
Estimating sales growth
When assessing the competitive strength and investment merit of any firm, the first thing we like to do is to look at what's going on with sales - that's really the first level of inquiry that any investor should undertake. Ideally, we are looking to invest in companies whose sales are strong, consistent and generally growing faster than Nominal GDP Growth (that is, Real GDP Growth and Inflation combined). Based on Coca-Cola 's historical sales data, you can see that things have been reasonable. The 10-year sales growth rate has been 5.7% a year. This compares to nominal GDP Growth of 3.3% per year over the same period. Starting in 2013, however, Coca-Cola 's sales flopped due to changing consumer preferences and shifting health trends. Even with this decline, acquisitions in the energy drinks, fruit drinks, and coffee markets should help to support sales moving forward.
Overall we think the company is on solid ground and retains substantial pricing power. We feel comfortable saying you can invest in this company if you're looking for steady sales. Coca-Cola 's sales growth has been -2.1% per year over the last five years and -3.7% per year over the last three years. Coca-Cola 's three-year revenue growth is actually ranked lower than 78.0% of the 73 companies in the Soft Drinks Industry. That said, we think sales have stabilized and management is forecasting 3% growth for 2017. We continue to expect good and predictable things from this company in the future.
Figure 1: revenues ($ Millions) and revenue growth (%)

The second thing we like to do when assessing sales is to look at consensus market estimates. As reported in Yahoo Finance, the market is projecting -17.6% annual growth for this year and -11.5% for next year. These estimates are drawn from the projections of 19 analysts. The sales estimate is $34.5 billion for 2017, which compares to the year-ago estimate of $41.9 billion. Note that the company is targeting at least 3.0% growth for next year, which would imply total sales of $43 billion.
A third thing we like to do when assessing sales is to compute the firm's Sustainable Growth Rate. The sustainable growth rate reflects the rate of growth in sales that a firm can support given its existing earnings power, capital resources and dividend payout policy. In any given year, a firm's sustainable growth rate is calculated by multiplying its return on equity (ROE) by its retention rate. Rather than rely on data from only one year, though, we calculate sustainable growth by using the firm's three-year average ROE and three-year average Retention Rate. Coca-Cola 's ROE averaged 25.2% over the last three years while its Retention Rate averaged 16.9%, giving the firm a sustainable growth rate of 4.3% per year.
Let's recap briefly what the sales data is showing us. From what we can tell, it is not unreasonable to estimate that sales over the next five years could grow at a rate of somewhere between -15% and 6%.
Table 1: choices for possible growth rates
Growth Rate (%) | Rationale |
-4 | The 3-Year Growth Rate |
-2 | The 5-Year Growth Rate |
6 | The 10-Year Growth Rate |
-15 | The 2-year average consensus growth estimate |
3 | The firm's guided growth rate |
4 | The Sustainable Growth Rate |
We're going to select a rate of 2.0%. With $41.8 billion in sales generated last year, this means we believe sales will continue to grow in the future and will reach about $46.1 billion in five years. This estimate reflects our understanding of the firm's historical results, market demand, population growth, pricing trends and changing consumer preferences.
Estimating earnings per share
Now that we have generated our sales estimates, we're going to estimate growth in earnings per share. This method applied below takes the sales growth projection - in this case, 2.0% per year - and subtracts the expenses and taxes. What we're left with are the earnings. Then we divide by the projected number of diluted shares outstanding to determine the earnings per share (see table below).
A projected growth rate of 2.0% will result in almost $46.1 billion in sales five years out. Now we need to take a look at the firm's pretax profit margin (what's left over after expenses but before taxes are subtracted). In Figure 2 below, we can see that Coca-Cola is experiencing some pressure on its profit margin - 24.5% in 2013, 20.3% in 2014, 21.7% in 2015 and 19.4% in 2016. The average for the last five years has been 22.1%, and the average for the last 10 years has been 25.5%. Coca-Cola's margins will normalize at its medium-term mean of about 22.0%. At this rate, projected pretax profits on $46.1 billion in sales would be just over $10.1 billion. This means expenses would amount to $36 billion.
Figure 2: Pretax profit margins (%)

The next step in our estimation process is to establish what tax rate will be paid on the company's profits. The most recent year's rate was 19.5%. Normally we wouldn't play with that number too significantly because in general, it shouldn't change much from year to year. The only time we would make major changes to this number would be in instances where maybe the current rate differed significantly from that of the past or if we had some knowledge about what rate was likely going to persist in the future, perhaps because the company is going to get some preferential tax treatment on operations abroad. For Coca-Cola over the last 10 years, the company's tax rate has been as low as 16.7% and as high as 24.8%. Tax rates for most U.S. companies will fluctuate between 35% and 40%. We're going to select a rate of 22.0% given its broad international exposure, representing the average rate of the last 10 years, excluding the influence of nonrepresentative years. This would result in a tax expense of $2.2 billion from pretax profits of $10.1 billion in five years. This would leave us with $7.9 billion in projected earnings five years from now.
Our next main consideration is a matter of determining the number diluted shares that will be outstanding in five years. Coca-Cola has decreased the number of shares outstanding over the last decade. There were 4.7 billion shares outstanding in 2007, then the number of shares went down to 4.6 billion in 2011 and then fell to 4.4 billion in 2016. Currently there is 4.3 billion shares outstanding. This data suggests that the company has been redeeming about 32 million shares per year. We're going to rely on the company's historical share purchase activities to guide our estimation process, but will be more neutral as we think the company is finding fewer high-valued uses of its cash to stimulate growth. As such, we project share purchase of about 32 million per year over the next five years.
With shares estimated at 4.2 billion in five years, EPS is expected to grow at a compound rate of 4.9% over the period. This is higher than our projected five-year revenue growth rate and reflects stability in the firm's margins. Note that it doesn't always work out this way. Based on this EPS growth forecast, we are expecting EPS of $1.89 five years out. Results of our forecasting procedure are summarized in the table below.
Table 2: path from projected sales to projected earnings
Path From Projected Sales to Projected Earnings | ||
A Simple Procedure for Estimating EPS | ||
Sales in last fiscal year (M) | $41,863 | |
Projected sales growth rate | 2.0% | |
Forecasted sales in five years (M) | $46,118 | |
Projected net profit margin | 22.0% | |
Net profit in five years (M) | $10,146 | |
Expenses (M) | $35,972 | |
Projected tax rate | 22.0% | |
Taxes on pretax profits in five years (M) | $2,232 | |
Net income projected in five years (M) | $7,914 | |
Projected shares outstanding (M) | 4,185 | |
Earnings per share in five years | $1.89 | |
EPS in last fiscal year | $1.49 | |
Projected EPS growth rate | 4.9% | |
Forecasting a target P/E multiple
Now we need to take a look at the price history of the company's stock. From Figure 3, we can see that the spread between the high and low stock prices has declined modestly over the last 10 years. We have a current price of $41.60 with a high in the past 10 years of $45.83 and a low of about $33.50. We want to keep this variability in mind when establishing our upper and lower valuation range. Specifically, given the firm's historical stock price behavior, we should expect the stock to fluctuate by about $6.15 over the course of a year.
Figure 3: stock price history - c lose, high, low

Coca-Cola 's stock has traded at a volatile price-earnings (P/E) multiple over the last decade, averaging 21.4 over the last 10 years, 24.0 over the last five years and 26.6 over the last three years. Currently the firm is trading at 27.7 times trailing 12-month earnings per share and 22.1 times expected future earnings.
For determining an estimated target P/E multiple, the first thing we like to do is eliminate any outliers from the historical data series. This includes abnormal P/Es that are not reflective of the normal operations of the firm, and this could be the result of abnormal growth or significant one-time nonrecurring charges/gains. In the case of Coca-Cola , we are going to keep the long-term series intact. The next thing we like to do is to run an optimization procedure that reveals which P/E multiple yielded the best forecasting accuracy over the evaluation period. If in our judgment this multiple continues to accurately portray the earnings and cash-generating power of the company as well as the growth and risk characteristics of the firm, then we will use this multiple as our target multiple. If not, we will adjust the multiple upward or downward accordingly.
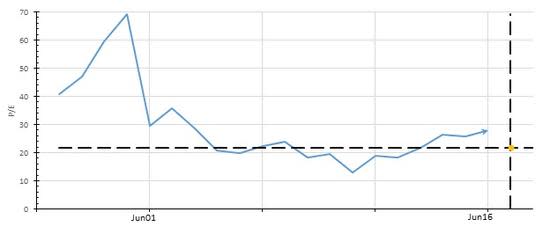
The figure below presents the historical P/E profile for Coca-Cola . We will utilize a target P/E multiple of 21.8x that we believe reasonably characterizes the risk-return attributes of the company's stock. This multiple represents a contraction of -21.3% relative to the current multiple. It also represents a contraction of -18.2%, a contraction of -9.2% and an expansion of 2.1% relative to the three-year, five-year and 10-year average P/E multiples.
Figure 4: historical P/E multiple and target point of reversion
Setting a target price and valuation range
We selected a target P/E multiple of 21.8x. To determine a price target five years out, we then multiply this by our EPS estimate. EPS are estimated to reach $1.89 in five years giving us a target price of $41.22. This price is slightly lower than its current price but is generally in line with where it traded in 2014 and 2015. Nonetheless, to properly judge to what extent the stock may be under or overvalued, we need to determine a fair-value range within which we expect the stock to trade. To do this we rely on the trend-adjusted average annual trading range for the stock, which from the analysis above we know is $6.15. This means that, given our target price estimate, we expect the stock to trade naturally, and fairly, between $38.15 and $44.30. The result of this is that when the stock is trading below $38.15 it is in the Buy Zone and when the stock trades above $44.30 it is in the Sell Zone. Currently the stock is in the Neutral Zone.
Conclusion
What return can we expect for holding Coca-Cola 's stock? We know we can expect stock price depreciation of -0.9%. We can also expect to earn dividend income of about $7.00 over the evaluation period. Added to our price estimate, this means we could earn a compound annual rate of return of 3.0%, provided our estimates prove accurate. All in all, we are happy with this company but think that it is already fully valued and does not currently offer acceptable return potential to qualify for investment. We would recommend waiting for the stock to fall below $38 before purchasing.
Alternatively, if the firm is able to boost sales growth to at least 3.5%, we would assign the stock a $45 valuation and would consider this an acceptable valuation given the limited risk inherent in the position.
Disclosure: We do not hold any positions in Coca-Cola .
Start a free seven-day trial of Premium Membership to GuruFocus.
This article first appeared on GuruFocus.
Warning! GuruFocus has detected 5 Warning Sign with KO. Click here to check it out.
The intrinsic value of KO
