Can DO & CO Aktiengesellschaft's (VIE:DOC) ROE Continue To Surpass The Industry Average?

Want to participate in a short research study? Help shape the future of investing tools and you could win a $250 gift card!
Many investors are still learning about the various metrics that can be useful when analysing a stock. This article is for those who would like to learn about Return On Equity (ROE). By way of learning-by-doing, we'll look at ROE to gain a better understanding of DO & CO Aktiengesellschaft (VIE:DOC).
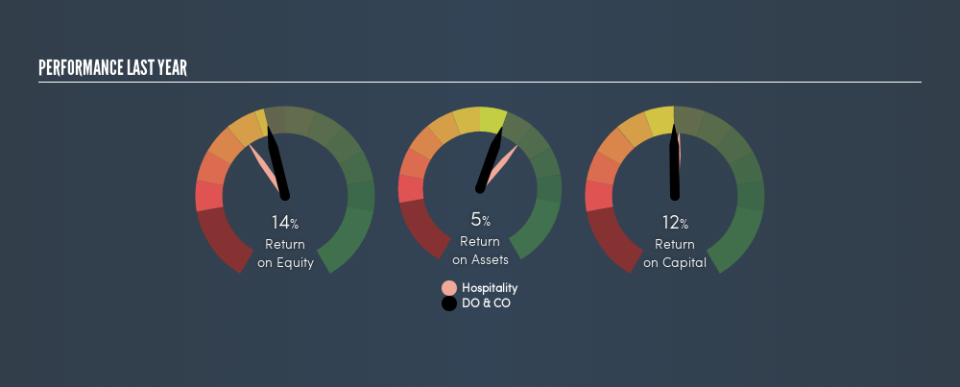
Our data shows DO & CO has a return on equity of 14% for the last year. That means that for every €1 worth of shareholders' equity, it generated €0.14 in profit.
View our latest analysis for DO & CO
How Do I Calculate ROE?
The formula for ROE is:
Return on Equity = Net Profit ÷ Shareholders' Equity
Or for DO & CO:
14% = €27m ÷ €248m (Based on the trailing twelve months to December 2018.)
Most know that net profit is the total earnings after all expenses, but the concept of shareholders' equity is a little more complicated. It is all earnings retained by the company, plus any capital paid in by shareholders. You can calculate shareholders' equity by subtracting the company's total liabilities from its total assets.
What Does Return On Equity Signify?
Return on Equity measures a company's profitability against the profit it has kept for the business (plus any capital injections). The 'return' is the amount earned after tax over the last twelve months. The higher the ROE, the more profit the company is making. So, all else being equal, a high ROE is better than a low one. That means it can be interesting to compare the ROE of different companies.
Does DO & CO Have A Good Return On Equity?
By comparing a company's ROE with its industry average, we can get a quick measure of how good it is. However, this method is only useful as a rough check, because companies do differ quite a bit within the same industry classification. As is clear from the image below, DO & CO has a better ROE than the average (10%) in the Hospitality industry.
That's what I like to see. We think a high ROE, alone, is usually enough to justify further research into a company. For example, I often check if insiders have been buying shares .
How Does Debt Impact ROE?
Most companies need money -- from somewhere -- to grow their profits. That cash can come from retained earnings, issuing new shares (equity), or debt. In the first two cases, the ROE will capture this use of capital to grow. In the latter case, the use of debt will improve the returns, but will not change the equity. Thus the use of debt can improve ROE, albeit along with extra risk in the case of stormy weather, metaphorically speaking.
Combining DO & CO's Debt And Its 14% Return On Equity
While DO & CO does have some debt, with debt to equity of just 0.61, we wouldn't say debt is excessive. Its very respectable ROE, combined with only modest debt, suggests the business is in good shape. Careful use of debt to boost returns is often very good for shareholders. However, it could reduce the company's ability to take advantage of future opportunities.
But It's Just One Metric
Return on equity is useful for comparing the quality of different businesses. A company that can achieve a high return on equity without debt could be considered a high quality business. If two companies have the same ROE, then I would generally prefer the one with less debt.
But ROE is just one piece of a bigger puzzle, since high quality businesses often trade on high multiples of earnings. It is important to consider other factors, such as future profit growth -- and how much investment is required going forward. So you might want to take a peek at this data-rich interactive graph of forecasts for the company.
Of course DO & CO may not be the best stock to buy. So you may wish to see this free collection of other companies that have high ROE and low debt.
We aim to bring you long-term focused research analysis driven by fundamental data. Note that our analysis may not factor in the latest price-sensitive company announcements or qualitative material.
If you spot an error that warrants correction, please contact the editor at editorial-team@simplywallst.com. This article by Simply Wall St is general in nature. It does not constitute a recommendation to buy or sell any stock, and does not take account of your objectives, or your financial situation. Simply Wall St has no position in the stocks mentioned. Thank you for reading.

