 The Ticket
Predictions blogging: How can we handicap Obama’s re-election chances?
As of this morning, a full year before the final balloons will drop at the last of the major presidential conventions of 2012, Barack Obama has a 50.9 percent likelihood of being elected U.S. president for a second term.
This prediction, of course, is based on our best estimate of the dynamics in the presidential race between now and November 2012--which are certain to change in the 14 months ahead. During that time, countless factors could affect the prospects for Obama's re-election. The economy could recover or get worse, some hot-button social issues could come to the fore in the race, and others may recede. More conflicts may arise overseas--while present ones could work themselves out. And there is of course the ever-present chance that scandals--some big, some small, some real, and some contrived--will erupt.
So what does this 50.9 percent likelihood really mean, then? Imagine if the world were to accommodate one thousand scenarios--each equally likely to happen; imagine further, that among those, one such scenario were randomly selected to represent how things play out on Election Day. And in this randomized array of likely presidential-election outcomes, our modeling suggests that Obama wins re-election 509 out of 1,000 occurrences, while losing in 491. Exactly 16 months from Election Day, the outcome of the presidential contest is just about as undecided as any future event can be.
This shouldn't come as any great surprise--but it does serve as a reminder of what's involved in modeling the mathematical likelihood of how a future event will be resolved. While numerically based predictions have the ring of certainty, they can prove quite volatile over time, based on the sorts of inputs they employ. You can readily see this trend in the chart below, which plots the likelihood of Obama's election in tandem with some of this spring and summer's main political events:
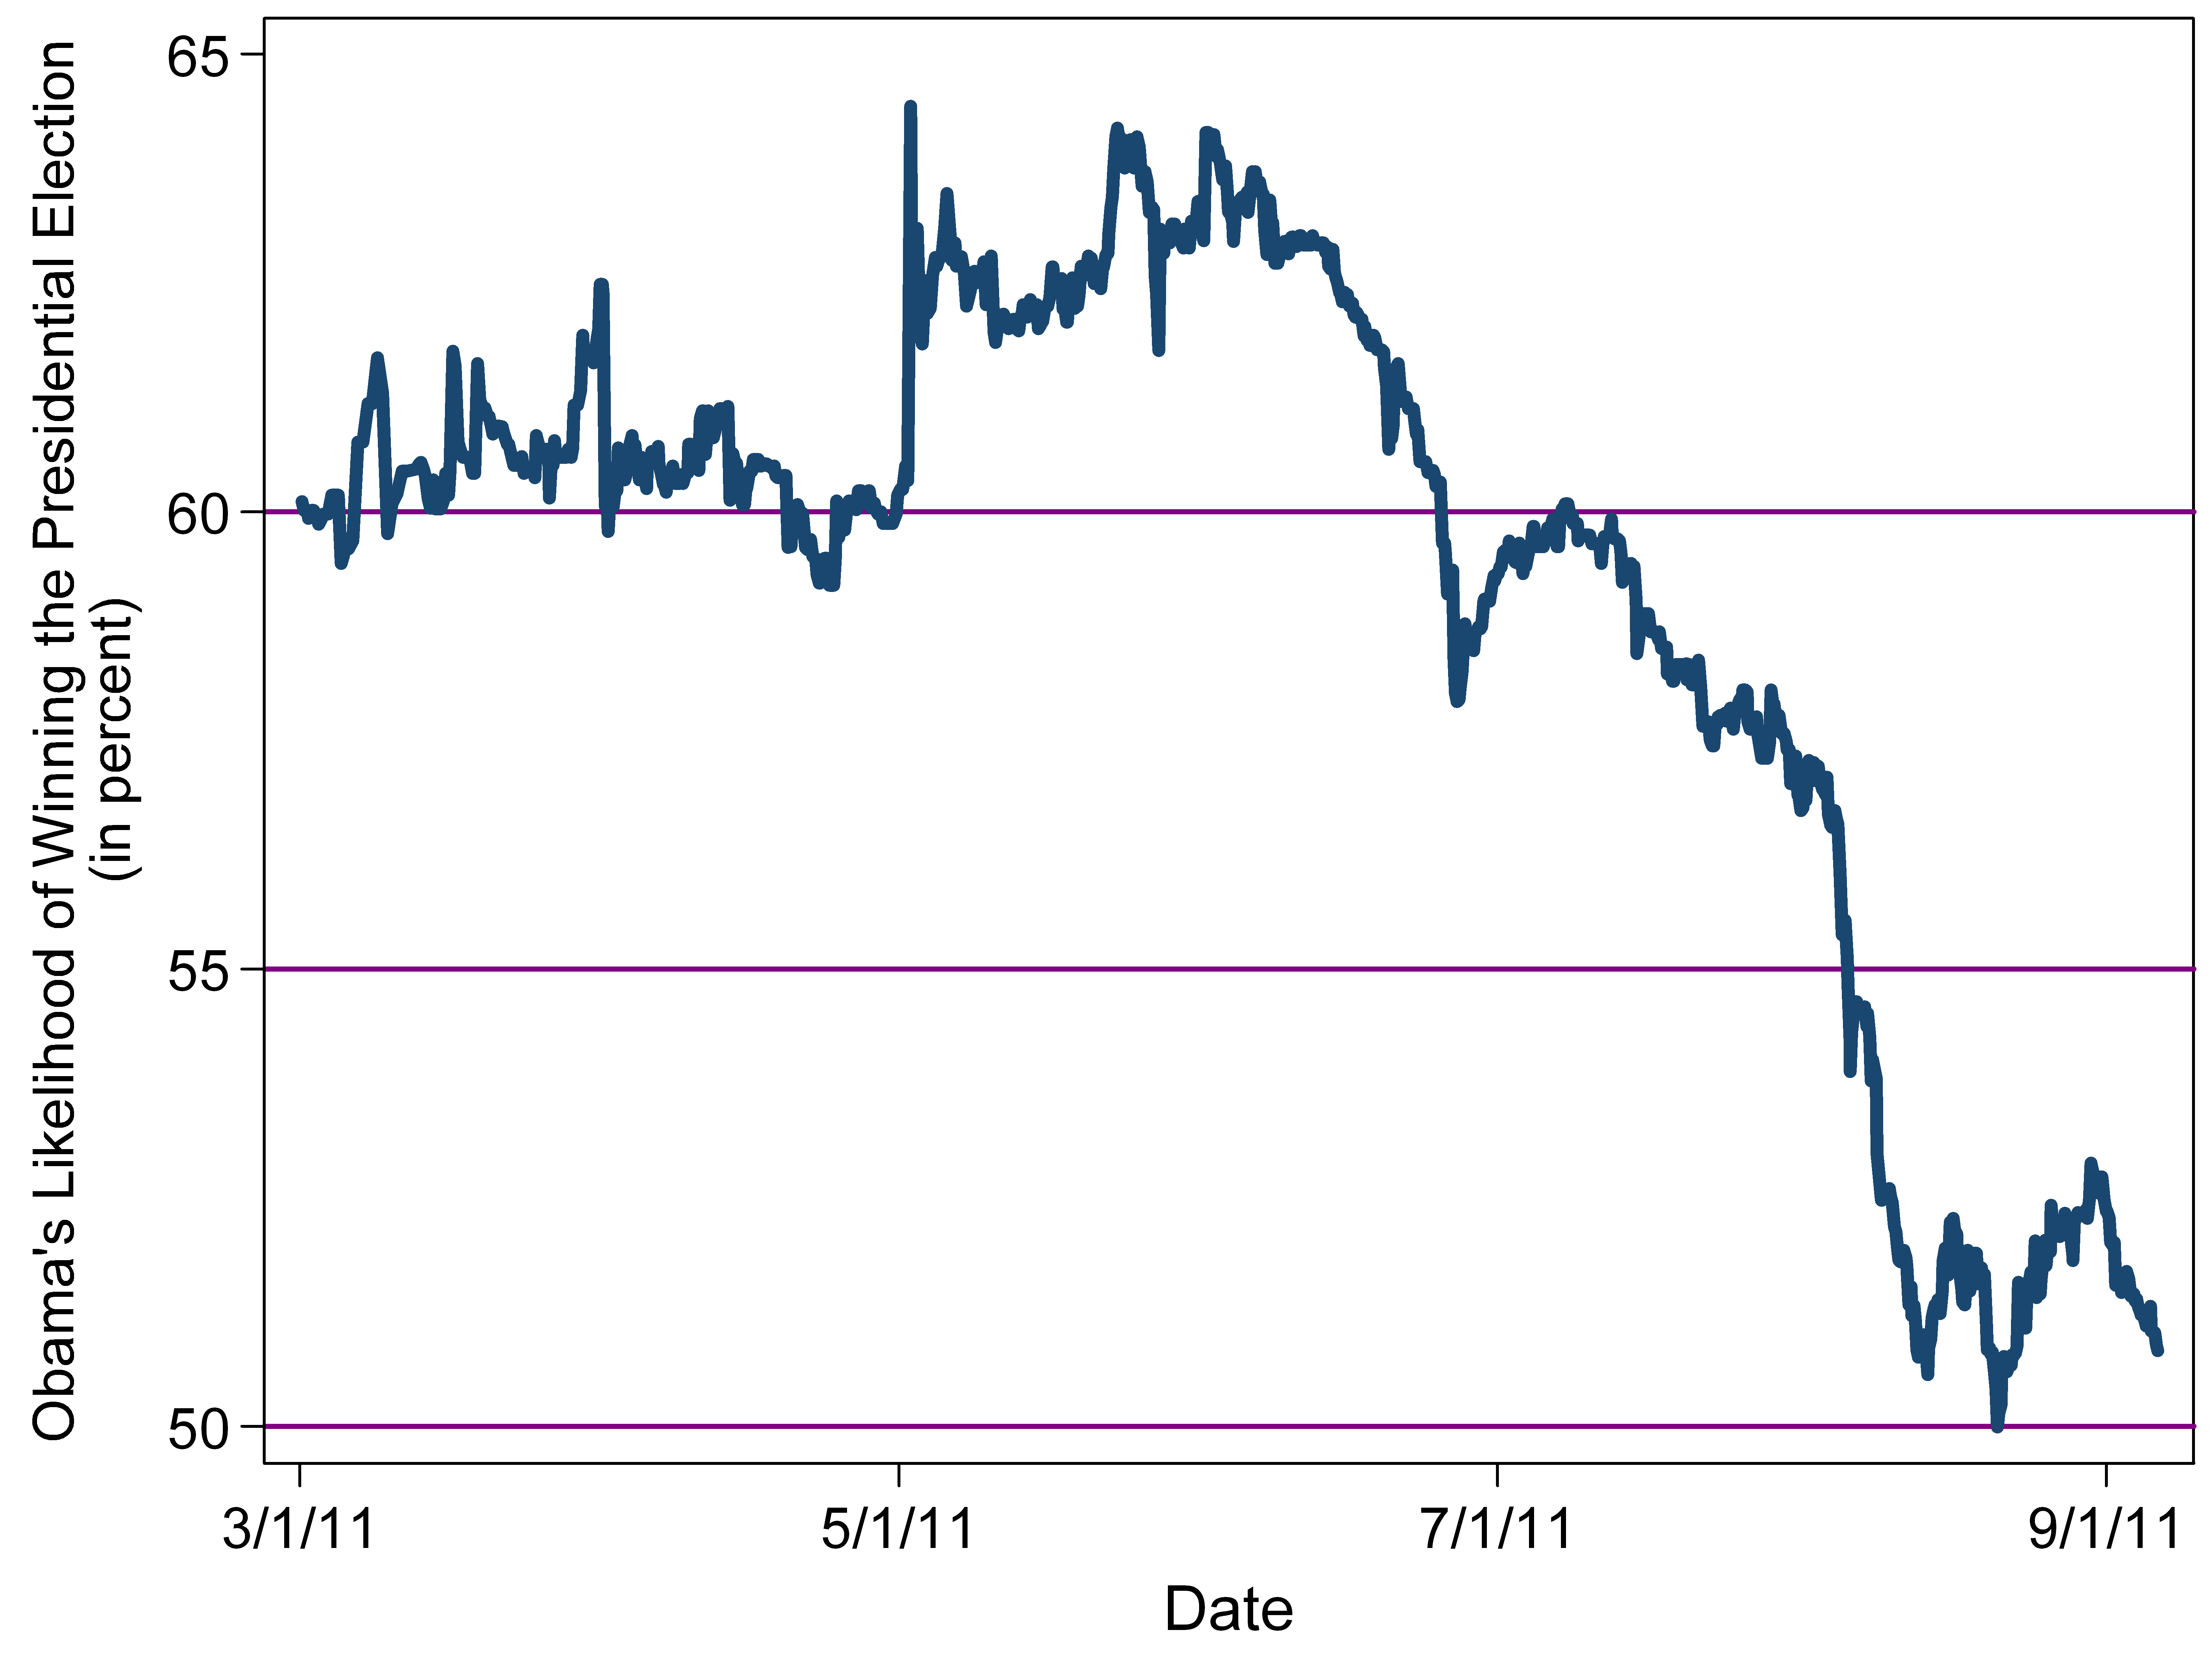
That massive spike in early May came in the wake of the news that U.S. soldiers had killed Osama bin Laden. After about a month and half of steady to slightly rising numbers, Obama's re-election chances have shown a slow and steady descent, as bad economic news followed more bad economic news, the debt ceiling crisis, which in turn segued into ... still more bad economic news.
In the political season ahead, I will be examining prediction markets, polls, fundamental data--together with data generated by you, the users of Yahoo!--to create and discuss predictions of how the upcoming election will come together at the presidential, congressional, state and local levels. Joining me in this new blogging venture will be Yahoo! computer scientist David Pennock, other Yahoo! Research scientists, and a collection of top experts in forecasting and predictions from around the world.
As we move forward, I will be explaining in greater detail how we create these predictions, for readers of a wonkier persuasion. For everyone else, however, here is a quick overview of the four main sources of data we will be examining.
Prediction markets These data-based exchanges allow users to buy and sell contracts on the outcome of various events, including political elections. These markets effectively aggregate the information of users from around the world; their price is a very useful indication of the likely outcome of the event in the market. A slew of academic papers have shown the effectiveness of these markets in forecasting outcomes from late 19th and early 20th century elections through the 2008 election. At this moment, with more than 400 days before Election Day, prediction markets furnish the main input in our data breakdowns--but this, too, will change as the election draws nearer.
Polls Even the most casual followers of the election process know that opinion surveys are crucial sources of data. Major polling companies of course take the electorate's temperature on a regular basis with one simple question: "Who would you vote for if the election were held today?" This has been the main source of data for predicting elections since George Gallup popularized the modern political poll in 1936.
Fundamental data This is a vast network of related information, including the results of previous elections, demographics of specific voting districts, and how factors such as a candidate's incumbency can predict a given election's outcome. This very simple data is a surprisingly strong predictor of upcoming events. If, for example, you want to get a really quick and simple forecast of the vote share that Obama will get in Kentucky in 2012, you can simply consult he vote share that he received in the state in 2008, and then factor in the change in the state's unemployment rate since the last election.
Yahoo! data This is where you, the Yahoo! reader, come in. Data drawn from your participation in Yahoo! surveys and crowdsourcing efforts will be a critical piece of our prediction models this cycle. Stay tuned as my colleague David Pennock and I continue blogging, and explain the many ways that you can get involved. And feel free, in the comments section of all our posts, to tell us what you think of our work, and what other events you'd like to see modeled for future predictions. And there is one thing I can forecast with 100 percent certainty: Our predictions blog will be hosting a very fun and informative conversation with you in the 14 months leading up to election day.
David Rothschild is an economist at Yahoo! Research. He has a PhD in applied economics from the Wharton School of Business at the University of Pennsylvania. His dissertation is on creating aggregated forecasts from individual-level information.

