T-minus 363 days to election 2012: Welcome to The Signal!

As voters head to the polls today for the 2011 elections, we are a little less than a year away from selecting the next President of the United States. As of this morning, there's a 67.3 percent chance that Republican Mitt Romney will challenge Democratic incumbent Barack Obama in the 2012 general election. Rick Perry, at 10.4 percent, is the second likeliest Republican nominee for President, with Newt Gingrich (8.3 percent) following closely behind. Barack Obama's likelihood of prevailing and winning reelection for a second term is slightly better than a coin flip; Obama has a 50.5 percent likelihood of victory.
[ Destination 2012: Check out Yahoo!'s election headquarters ]
These predictions, of course, are based on the best estimate of the dynamics in the presidential race between now and November 2012--which are certain to change in the 12 months ahead. During that time, countless factors could affect the prospects for Obama's reelection. The economy could recover or get worse, some hot-button social issues could come to the fore in the race, and others may recede. More conflicts may arise overseas--while present ones could work themselves out. And there is of course the ever-present chance that scandals--some big, some small, some real, and some contrived--will erupt.
So what does this 50.5 percent likelihood really mean, then? Imagine if the world were to accommodate one thousand scenarios--each equally likely to happen; imagine further, that among those, one such scenario were randomly selected to represent how things play out on Election Day. And in this randomized array of likely presidential-election outcomes, our modeling suggests that Obama wins re-election 505 out of 1,000 occurrences, while losing in 495. 12 months from Election Day, the outcome of the presidential contest is just about as undecided as any future event can be.
As of now, we compute these estimates by taking an average of the prices listed on prediction markets Betfair and Intrade. A prediction market is a place where political handicappers back up their convictions with real money. The price is determined by how much money users are willing to invest up front in order to win back one dollar if they are right. If a 90-cent investment is required to win one dollar, users think the candidate is likely to win. If, on the other hand, only a few pennies investment is required to win one dollar, users are saying the candidate is a longshot. Users from around the world act based on any information they have, including well-known central signals of upcoming events like polls and past results, as well as less obvious, more disaggregated indicators. Many academic papers have confirmed the value of prediction markets in forecasting upcoming events; for politics elections, prediction markets have proved been meaningful from late 19th and early 20th century elections through the 2008 election.
Obama's likelihood of being reelected President has hovered around 50 percent since Labor Day, declining slightly throughout September before rebounding in October.

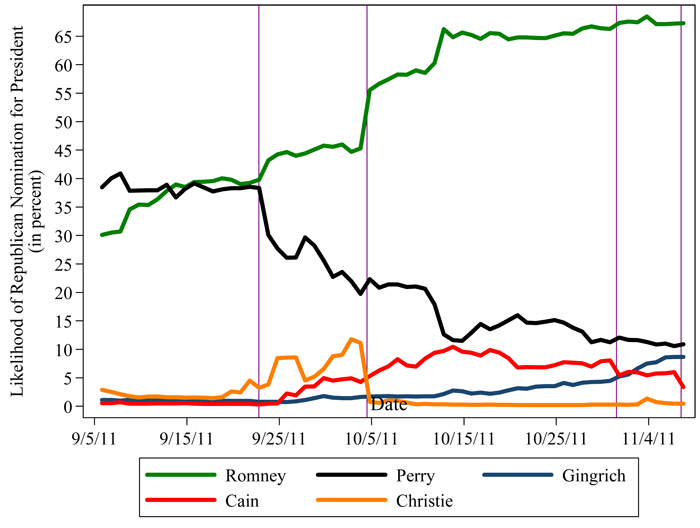
In contrast, the prospects of the major challengers for the Republican nomination have seen wild swings since Labor Day. In the chart below, I've highlighted a few important events of the last two months. After Perry's disastrous third Republican debate on September 22, Perry, who had already plateaued, immediately started a steep decline. When Perry collapsed, Romney got a small bump, but Chris Christie, the preferred candidate at the time of the anyone-but-Romney crowd, was the biggest beneficiary. Then on October 4, when Christie ended his flirtation and announced that he was not going to run for President, Romney immediately gained almost all of the share of likelihood that Christie lost. More recently, Politico's news of Cain's sexual harassment allegations on October 31 was bad news for Cain but good for Gingrich. It got worse for Cain a week later on November 7 when one of Cain's accusers held a press conference. The primary race realigned considerably after each of these major events.
In the political season ahead, in addition to prediction markets, we will be examining polls and fundamental data--together with data generated by you, the users of Yahoo!--to create and discuss predictions of how the upcoming election will come together at the presidential, congressional, state and local levels. Joining me in this new blogging venture will be Yahoo! computer scientist David Pennock, other Yahoo! Research scientists, and a collection of top experts in forecasting and predictions from around the world.
As we move forward, we will be explaining in greater detail how we create these predictions, for readers of a wonkier persuasion. For everyone else, however, here is a quick overview of the three additional sources of data that will be added int he next few weeks and months:
Polling data will include the results to the ubiquitous question "Who would you vote for if the election were held today?". The most casual followers of the elections know that polls of voter intention are crucial sources of data. Major polling companies run these polls, many times in conjunction with newspapers, throughout the course of major elections. This has been the main source of data for predicting elections since George Gallup popularized the scientific representative political poll in 1936.
Fundamental data will include past election results, economic indicators, ideological indicators, and biographical information about the candidates. Fundamental models provide very useful early indications of the elections, as they do not rely on either polling or prediction market data. Further, with these models we can address interesting issues like the relative importance of national versus state economic indicators and incumbency in different types of elections.
Yahoo! data will include search results, internal polling, and prediction games. The data points will serve three purposes for The Signal. First, the data will enter into our models and help inform both predictions and sentiment. Second, we will be testing new procedures for both polling and prediction games that we hope will generate unique information from Yahoo! users. The Signal is not just reporting data, but we will experiment with the most advanced procedures for generating data. Third, we hope that these interactive elements will help you, our users, feel more invested than ever in the election. There is nothing more important to us than to encourage you to learn about the candidates and the races.
We're launching with real-time up-to-the-minute predictions of the likelihood of the Republican nomination and the likelihood of the Presidential election. More of these pages will follow the next few weeks. To learn more about our mission, read David Pennock's companion article. Welcome to The Signal!
David Rothschild is an economist at Yahoo! Research. He has a Ph.D. in applied economics from the Wharton School of Business at the University of Pennsylvania. His dissertation is in creating aggregated forecasts from individual-level information (polls, prediction markets, etc.). Follow him on Twitter @DavMicRot and email him at thesignal@yahoo-inc.com.
Other popular Yahoo! News stories:
Fourth accuser urges Herman Cain to 'come clean' about harassment
Accuser's press conference cuts Herman Cain's odds in half in prediction markets
More than 49 million Americans — even more than thought — live in poverty, new measure finds
Want more? Visit The Signal blog or connect with us on Facebook and follow us on Twitter.

