Better Int'l ETFs By iShares
Earlier last week, iShares filed paperwork detailing plans for several new ETFs based on MSCI investable market indices. The importance? Investors might soon have a better way of gaining true exposure to the international equity space.
The new fund proposals from iShares were:
iShares MSCI Emerging Markets Investable Market Index Fund
iShares ACWI Investable Market Index Fund
iShares MSCI ACWI ex-US Investable Market Index Fund
iShares MSCI EAFE Investable Market Index Fund
The significance in the recent filing is that investors will finally have access to some of the broadest exposure available in the international equity space. The MSCI Investable Market Indexes (IMI) capture 99 percent of investable equities. This goes much deeper than the traditional MSCI indexes that iShares and Vanguard ETFs usually track that capture the top 85 percent of total market capitalization. The end result:Most international equity ETF investors have only been getting exposure to large and midcap stocks.
The filings above are welcome additions to their respective spaces in the market, but there are two sectors that pique my interest—that of the emerging markets space and the developed ex-U.S. market.
It seems a bit crazy to me that for so long, investors have been short-changed in their exposure to these markets. Coverage matters. It wasn’t too long ago that we saw what a difference broad exposure makes when tracking an index. In the emerging markets space, the battle between the iShares MSCI Emerging Market ETF (EEM) and the Vanguard Emerging Markets ETF (VWO) brought this to light.

When the market topped out in late 2007, VWO had outperformed EEM by nearly 5 percent. At the time, the difference was largely due to VWO’s full replication strategy—a contrast to EEM’s optimization strategy that focused on holding a subset of the index.
In the case of the new filings, portfolio strategy isn’t so much the issue as the additional sector exposure and coverage that investors may gain from the inclusion of the bottom 15 percent of the investable universe in these markets.
In the emerging markets space, the prospective iShares MSCI Emerging Markets IMI Fund will compete directly with EEM and VWO. Until the fund launches, we can only speculate on its actual sector exposure based on the current composition of the index.
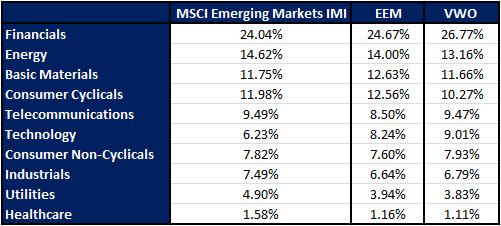
One thing is clear:The MSCI Emerging Markets IMI is slightly less focused on financials than EEM and VWO. There’s greater exposure to energy stocks, and significantly greater focus on the utilities and industrials sectors. EEM and VWO also take on larger companies in the technology space, while the index focuses on telecommunications firm. The slight tilts have also translated into performance differences:Over the past three years, the index has returned 6.82 percent, while EEM and VWO have returned 5.23 percent and 6.36 percent, respectively.
Interestingly, both EEM and VWO carry slightly increased risks relative to the IMI version of the index, with betas of 1.02 and 1.01, respectively. From the general looks of things, investors may gain some broader exposure in the newer fund without giving much up with regard to risk.
VWO has amassed over $54 billion in assets compared with EEM, which has $35 billion in assets. The key difference between the two is price—while VWO charges 20 bps, EEM charges 67. The new fund may provide access to smaller firms, but it’ll need to be competitive on the price front to really attract some attention.
In the developed ex-U.S. space, the prospective iShares MSCI EAFE Investable Market Index Fund will compete directly with the iShares MSCI EAFE Fund (EFA) and the Vanguard MSCI EAFE Fund (VEA). A comparison of the two funds against the IMI index gives a glimpse of what the new fund may look like.

Industry and sector tilts are a bit more pronounced in the IMI version of the index. Unlike EFA and VEA, the index pulls away from the health care sector and focuses more of its exposure on industrials and technology. There’s also less exposure in the consumer non-cyclicals space that is diverted to consumer cyclicals.
Although VEA is cheap at 12 basis points compared with EFA’s 34 bps expense ratio, assets are a different story. VEA holds nearly $9 billion in assets, while EFA has near $36 billion in AUM. EFA launched in late 2001, making it a much older fund than VEA. It’s likely that investors who got in early were unwilling to pay up in capital gains to make the switch to the cheaper VEA—another case where being first to market sets one apart. The new fund from iShares will still have to be competitive in terms of price, but its biggest enemy will be its fellow fund, EFA.
I always welcome a broader offering to the marketplace, but investors should take some notes as to what they’re getting out of these funds. While the indexes above point to some significant tilts, keep in mind iShares will likely utilize a sampling strategy, so there’s no telling what the final products may look like. At the very least, here’s to hoping that the pricing for these new funds is on the cheaper end.
At the time this article was written, the author had no positions in the securities mentioned. Contact Ugo Egbunike at uegbunike@indexuniverse.com.
Permalink | ' Copyright 2012 IndexUniverse LLC. All rights reserved
More From IndexUniverse.com
