Is Australian Agricultural Company Limited (ASX:AAC) A Buy At Its Current Price?

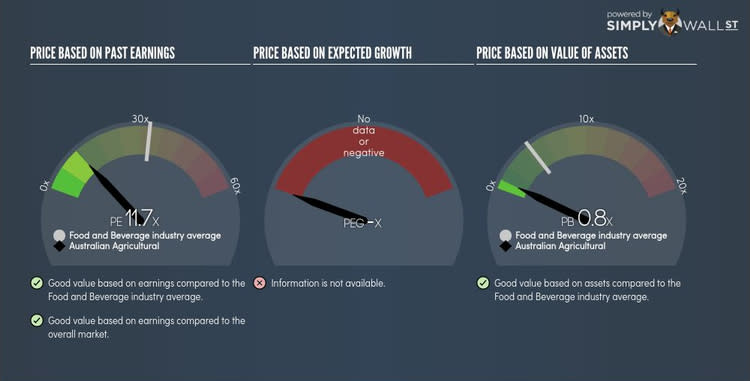
Australian Agricultural Company Limited (ASX:AAC) is currently trading at a trailing P/E of 11.7x, which is lower than the industry average of 28.5x. Although some investors may jump to the conclusion that this is a great buying opportunity, understanding the assumptions behind the P/E ratio might change your mind. Today, I will deconstruct the P/E ratio and highlight what you need to be careful of when using the P/E ratio. View our latest analysis for Australian Agricultural
Demystifying the P/E ratio
P/E is often used for relative valuation since earnings power is a chief driver of investment value. By comparing a stock’s price per share to its earnings per share, we are able to see how much investors are paying for each dollar of the company’s earnings.
Formula
Price-Earnings Ratio = Price per share ÷ Earnings per share
P/E Calculation for AAC
Price per share = 1.55
Earnings per share = 0.132
∴ Price-Earnings Ratio = 1.55 ÷ 0.132 = 11.7x
The P/E ratio itself doesn’t tell you a lot; however, it becomes very insightful when you compare it with other similar companies. Ideally, we want to compare the stock’s P/E ratio to the average of companies that have similar characteristics as AAC, such as size and country of operation. A common peer group is companies that exist in the same industry, which is what I use below. Since it is expected that similar companies have similar P/E ratios, we can come to some conclusions about the stock if the ratios are different.
AAC’s P/E of 11.7x is lower than its industry peers (28.5x), which implies that each dollar of AAC’s earnings is being undervalued by investors. As such, our analysis shows that AAC represents an under-priced stock.
Assumptions to be aware of
While our conclusion might prompt you to buy AAC immediately, there are two important assumptions you should be aware of. The first is that our “similar companies” are actually similar to AAC. If the companies aren’t similar, the difference in P/E might be a result of other factors. For example, if you are inadvertently comparing lower risk firms with AAC, then AAC’s P/E would naturally be lower than its peers, since investors would value those with lower risk with a higher price. The other possibility is if you were accidentally comparing higher growth firms with AAC. In this case, AAC’s P/E would be lower since investors would also reward its peers’ higher growth with a higher price. The second assumption that must hold true is that the stocks we are comparing AAC to are fairly valued by the market. If this assumption is violated, AAC's P/E may be lower than its peers because its peers are actually overvalued by investors.
What this means for you:
Are you a shareholder? Since you may have already conducted your due diligence on AAC, the undervaluation of the stock may mean it is a good time to top up on your current holdings. But at the end of the day, keep in mind that relative valuation relies heavily on critical assumptions I've outlined above.
Are you a potential investor? If AAC has been on your watch list for a while, it is best you also consider its intrinsic valuation. Looking at PE on its own will not give you the full picture of the stock as an investment, so I suggest you should also look at other relative valuation metrics like EV/EBITDA or PEG.
PE is one aspect of your portfolio construction to consider when holding or entering into a stock. But it is certainly not the only factor. Take a look at our most recent infographic report on Australian Agricultural for a more in-depth analysis of the stock to help you make a well-informed investment decision. Since we know a limitation of PE is it doesn't properly account for growth, you can use our free platform to see my list of stocks with a high growth potential and see if their PE is still reasonable.
To help readers see pass the short term volatility of the financial market, we aim to bring you a long-term focused research analysis purely driven by fundamental data. Note that our analysis does not factor in the latest price sensitive company announcements.
The author is an independent contributor and at the time of publication had no position in the stocks mentioned.
