AUD/USD Forex Technical Analysis – Increasing Selling Pressure into Close Targets Main Bottom at .7202
The Australian Dollar is under pressure on Friday, as investors feared an escalation in the U.S.-China trade dispute. Traders are reacting to a report from Bloomberg on Thursday that U.S. President Trump is ready to impose tariffs on $200 billion more in Chinese imports as soon as public comment period on the plan ends next week.
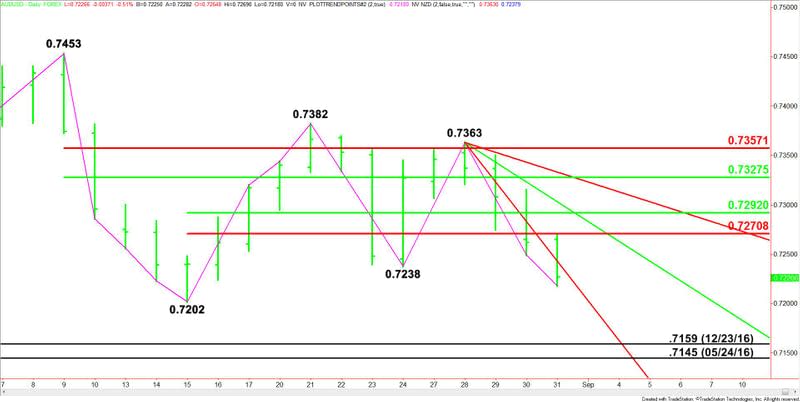
At 1558 GMT, the AUD/USD is trading .7214, down 0.0038 or -0.53%.
In other news, official data showed China’s manufacturing sector unexpectedly picked up in August, after a two-month slide. However, this news failed to boost confidence as trade tensions were on investors’ minds. China is Australia’s largest trading partner.
Daily Technical Analysis
The main trend is down according to the daily swing chart. If was reaffirmed earlier in the session when sellers took out the last main bottom at .7238.
The AUD/USD is also trading on the weak side of a short-term retracement zone at .7271 to .7292, making this area new resistance.
Daily Technical Forecast
Based on the current price at .7214 and the earlier price action, the direction of the AUD/USD the rest of the session is likely to be determined by trader reaction to the steep downtrending Gann angle at .7243.
A sustained move under .7243 will indicate that sellers are still controlling the direction of the Forex pair. If the downside momentum continues then look for the selling to extend into the next major main bottom at .7202.
A failure at .7202 will signal that the selling pressure is increasing. At this point, investors will set their eyes on the December 23, 2016 main bottom at .7159 and the May 24, 2016 main bottom at .7145.
Overcoming the angle at .7243 could trigger a position-squaring short-covering rally into the close. This is followed by the short-term Fibonacci level at .7271.
This article was originally posted on FX Empire
More From FXEMPIRE:
Gold Price Prediction – Gold Slips as the Dollar Rebounds Following Softer Chicago PMI
EUR/USD Forex Technical Analysis – In Position to Post Bearish Weekly Closing Price Reversal Top
Precious Metals Edge Up on Geo-Political & Trade War Woes but Remains near Monthly Lows
E-mini S&P 500 Index (ES) Futures Technical Analysis – August 31, 2018 Forecast
