AUD/USD Forex Technical Analysis – August 7, 2017 Forecast
AUD/USD is trading flat shortly before the U.S. opening. Australia has a bank holiday and the U.S. economic data is light. So unless there is a surprise, we’re likely to see a tight, two-sided trade.
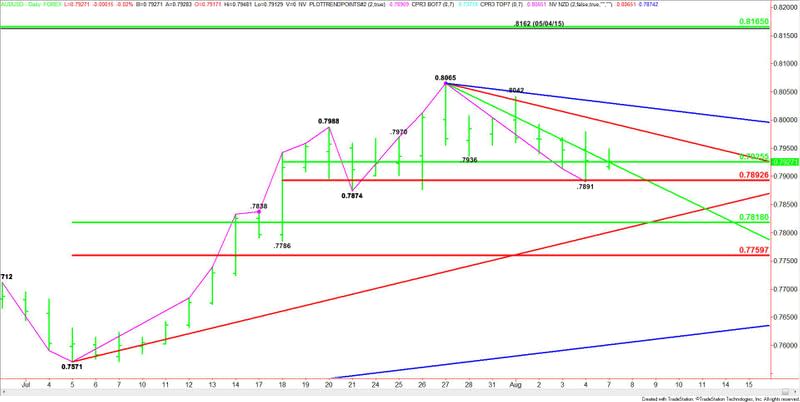
Technical Analysis
The main trend is up according to the daily swing chart. However, momentum has been trending lower since July 27. This is the day that Goldman Sachs issued a sell signal. The market is also under the influence of a dovish Reserve Bank of Australia that wants to see the currency lower and a surprisingly strong U.S. Non-Farm Payrolls report that somewhat supports the Fed’s plan to raise interest rates at least once more in 2017.
The main trend will change to down on a trade through .7874. Today is also the seventh day down from the top which puts it in the window of time for a potentially bullish closing price reversal bottom.
The short-term range is .7786 to .8065. Its retracement zone is .7922 to .7893. This zone is currently being tested.
The main range is .7571 to .8065. Its retracement zone is .7818 to .7760. This is the primary downside target. An uptrending angle passes through this zone at .7801, making it a valid downside target.
Forecast
Based on the current price at .7926, the direction of the AUD/USD today is likely to be determined by trader reaction to a support cluster at .7925.
A sustained move over .7925 will signal the presence of buyers. This could create enough upside momentum to trigger a rally into the next downtrending angle at .7995.
A sustained move under .7925 will indicate the presence of sellers. This could lead to a test of the short-term Fibonacci level at .7893, followed by yesterday’s low at .7891 and the July 18 main bottom at .7874.
If the selling is strong enough to take out .7874 then we could see an acceleration to the downside with the next targets .7818 and .7801.
Buyers seem to be coming in to defend .7874. Additionally, I don’t think bearish traders are willing to short weakness. This seven day break may be long-liquidation rather than short-selling.
Therefore, I’m looking for a near-term rally, perhaps 2 to 3 days. If this market is going lower then short-sellers should come in on the move. They are going to try to form a secondary lower top. This chart pattern may be designed to coincide with the release of Friday’s U.S. consumer inflation report.
This article was originally posted on FX Empire
