Do You Like Asbury Automotive Group, Inc. (NYSE:ABG) At This P/E Ratio?

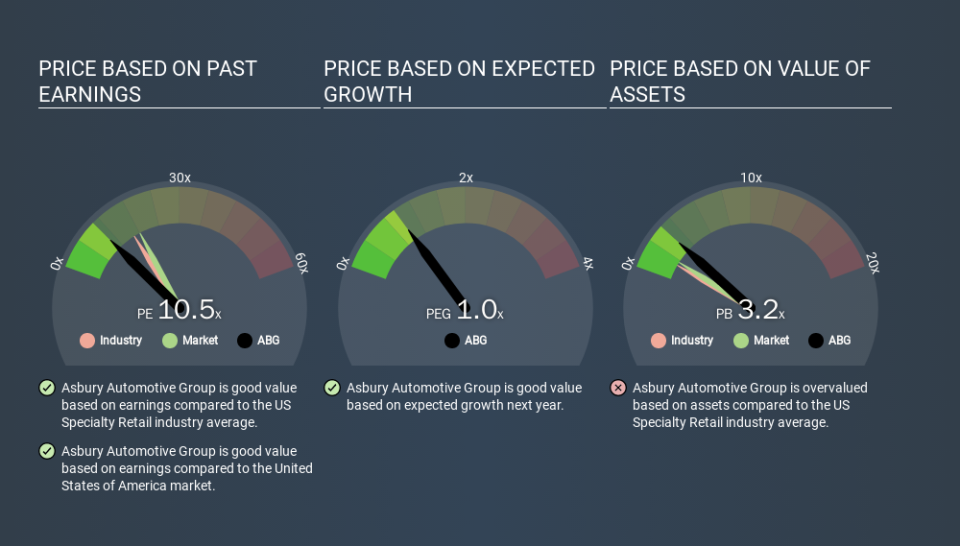
This article is written for those who want to get better at using price to earnings ratios (P/E ratios). We'll look at Asbury Automotive Group, Inc.'s (NYSE:ABG) P/E ratio and reflect on what it tells us about the company's share price. Based on the last twelve months, Asbury Automotive Group's P/E ratio is 10.52. In other words, at today's prices, investors are paying $10.52 for every $1 in prior year profit.
Check out our latest analysis for Asbury Automotive Group
How Do You Calculate A P/E Ratio?
The formula for P/E is:
Price to Earnings Ratio = Share Price ÷ Earnings per Share (EPS)
Or for Asbury Automotive Group:
P/E of 10.52 = USD99.26 ÷ USD9.44 (Based on the year to September 2019.)
Is A High Price-to-Earnings Ratio Good?
A higher P/E ratio means that buyers have to pay a higher price for each USD1 the company has earned over the last year. That is not a good or a bad thing per se, but a high P/E does imply buyers are optimistic about the future.
Does Asbury Automotive Group Have A Relatively High Or Low P/E For Its Industry?
The P/E ratio indicates whether the market has higher or lower expectations of a company. If you look at the image below, you can see Asbury Automotive Group has a lower P/E than the average (16.4) in the specialty retail industry classification.
Its relatively low P/E ratio indicates that Asbury Automotive Group shareholders think it will struggle to do as well as other companies in its industry classification. Many investors like to buy stocks when the market is pessimistic about their prospects. If you consider the stock interesting, further research is recommended. For example, I often monitor director buying and selling.
How Growth Rates Impact P/E Ratios
Probably the most important factor in determining what P/E a company trades on is the earnings growth. That's because companies that grow earnings per share quickly will rapidly increase the 'E' in the equation. And in that case, the P/E ratio itself will drop rather quickly. So while a stock may look expensive based on past earnings, it could be cheap based on future earnings.
It's great to see that Asbury Automotive Group grew EPS by 13% in the last year. And it has bolstered its earnings per share by 18% per year over the last five years. So one might expect an above average P/E ratio.
A Limitation: P/E Ratios Ignore Debt and Cash In The Bank
The 'Price' in P/E reflects the market capitalization of the company. Thus, the metric does not reflect cash or debt held by the company. In theory, a company can lower its future P/E ratio by using cash or debt to invest in growth.
Spending on growth might be good or bad a few years later, but the point is that the P/E ratio does not account for the option (or lack thereof).
So What Does Asbury Automotive Group's Balance Sheet Tell Us?
Net debt totals 99% of Asbury Automotive Group's market cap. This is a reasonably significant level of debt -- all else being equal you'd expect a much lower P/E than if it had net cash.
The Verdict On Asbury Automotive Group's P/E Ratio
Asbury Automotive Group trades on a P/E ratio of 10.5, which is below the US market average of 18.2. The company may have significant debt, but EPS growth was good last year. The low P/E ratio suggests current market expectations are muted, implying these levels of growth will not continue.
When the market is wrong about a stock, it gives savvy investors an opportunity. If the reality for a company is not as bad as the P/E ratio indicates, then the share price should increase as the market realizes this. So this free report on the analyst consensus forecasts could help you make a master move on this stock.
You might be able to find a better buy than Asbury Automotive Group. If you want a selection of possible winners, check out this free list of interesting companies that trade on a P/E below 20 (but have proven they can grow earnings).
If you spot an error that warrants correction, please contact the editor at editorial-team@simplywallst.com. This article by Simply Wall St is general in nature. It does not constitute a recommendation to buy or sell any stock, and does not take account of your objectives, or your financial situation. Simply Wall St has no position in the stocks mentioned.
We aim to bring you long-term focused research analysis driven by fundamental data. Note that our analysis may not factor in the latest price-sensitive company announcements or qualitative material. Thank you for reading.

