Are Airlines Stocks Ready To Take Off?

An index of airlines stocks is forming a potentially jumbo-sized bullish chart pattern.
Back in June, we posted a piece wondering “Can Airline Stocks Get Off The Ground?” At the time, the group (as represented by the Dow Jones U.S. Airlines Index) was a bit of a laughing stock on Wall Street. The Index was down over 30% from its 2015 high and hitting new lows for the year – even as most stocks were still in rebound mode off of the early-2016 lows. That said, from a long-term, or 30,000-ft, perspective, we saw some potential positives lining up for the group. Here’s the chart we posted then along with our rationale for potential optimism.
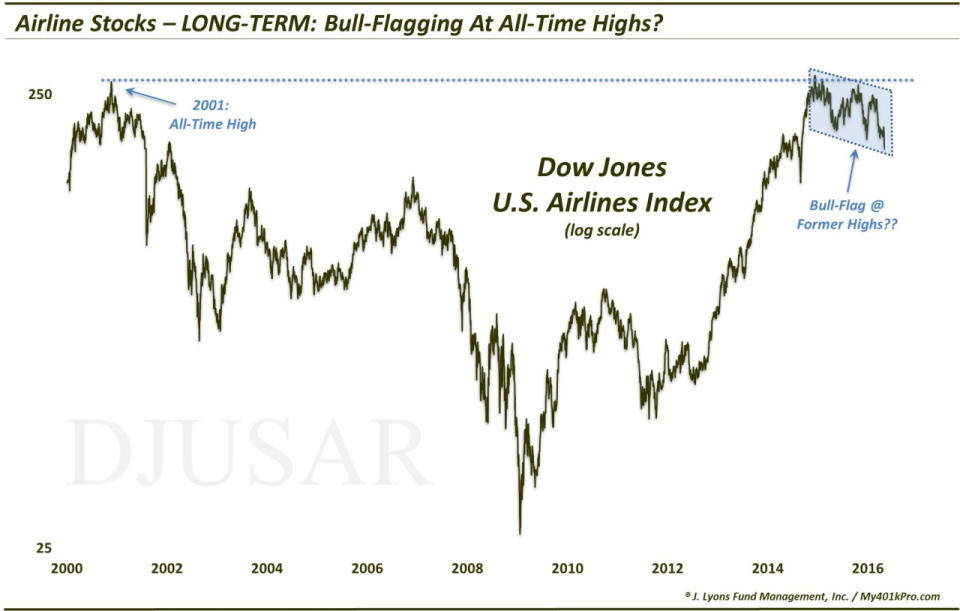
“If we scroll back on the Dow Jones U.S. Airline chart, to its inception in 2000, we find some potential reason for optimism, technically.Taking this view, we see why, at least partially, the rally stopped in January 2015. It was bumping into its all-time high from 2001. That said, there are potential positives in the manner in which the Airline sector has consolidated. First off, as we mentioned, the Airline index has remained relatively tight to its initial January 2015 highs. Yes, it has dropped some 27% and is hitting 20-month lows, however, it has retraced only a modest amount of its post-2012 rally. In the process, it has formed a potential “bull flag” as highlighted on the last chart. This is a formation whereby prices experience a tight, shallow consolidation following a rally. Typically, prices will resolve the pattern by breaking higher and resuming the prior uptrend.
Given the 3 waves down now within the consolidation pattern, the end of the pattern could be very near. And if this is indeed a bull flag, it could be setting up much higher prices, eventually. Considering the top of the bull flag equates to all-time highs, a break up and out of the flag would put the index into new high ground where there is zero turbulence, er, resistance.
So while airline stocks are one of the few sectors struggling to get off the ground currently, there is at least one potentially bullish interpretation of the group’s recent behavior. If the 18-month consolidation in airline stocks is a continuation pattern, they may soon be poised for liftoff - potentially aided by falling oil prices. Either way, if the airline sector is able to break out above the pattern, it could be all blue skies for this much maligned group.
Over the next 4 days, coinciding with Brexit, FYI, the DJ Airlines Index plunged as much as 13% to new lows. However, that would be all she wrote for the selloff. In the last 6 months, the Index has shot up 60%, breaking out of the aforementioned bull flag, and is presently bumping into the all-time highs set in 2001 and 2015. At this point, its long-term chart has the trappings of a cup-&-handle formation.
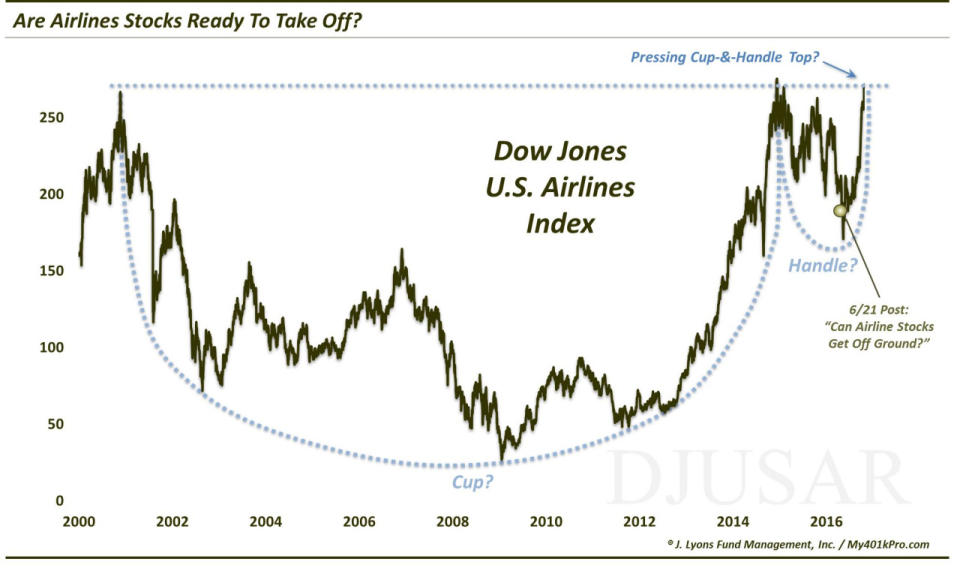
We have discussed this pattern in other posts in the past, including the fact that it typically is considered to be a bullish pattern. What does it look like and why is it bullish? The pattern involves 2 parts, generally showing the following characteristics:
The Cup (2001-2015): This phase includes an initial high on the left side of a chart followed by a relatively long, often-rounded retrenchment before a return to the initial high.
The Handle (2015-2016): This phase involves a shorter, shallower dip in the security and subsequent recovery to the prior highs.
The bullish theory is predicated on the idea that after taking a long time for a stock to return to its initial high during the “cup” phase, the “handle” phase is much briefer and shallower. This theoretically indicates an increased eagerness on the part of investors to buy since they did not allow it to pull back nearly as long or as deep as occurred in the cup phase. Regardless of the theory, the chart pattern has often been effective in forecasting an eventual breakout and advance above the former highs.
If this interpretation of the chart is accurate, there is no shortage of bullish potential for airlines should the breakout occur – and no shortage of applicable puns: e.g., “airline stocks could fly”, “ready for takeoff”, “blue skies above”, etc. So pick your favorite airline stock and just wing it (…sorry, just another bad pun, not advice).
________
More from Dana Lyons, JLFMI and My401kPro.
The commentary included in this blog is provided for informational purposes only. It does not constitute a recommendation to invest in any specific investment product or service. Proper due diligence should be performed before investing in any investment vehicle. There is a risk of loss involved in all investments.

