Applied Materials Inc’s (AMAT) EPS Grew 106.3% In A Year. Was It Better Than Long-Term Trend?

After reading Applied Materials Inc’s (NASDAQ:AMAT) latest earnings update (29 October 2017), I found it beneficial to look back at how the company has performed in the past and compare this against the most recent numbers. As a long-term investor I tend to pay attention to earnings trend, rather than a single number at one point in time. I also like to compare against an industry benchmark to understand whether AMAT has outperformed, or whether it is simply riding an industry wave. Below is a brief commentary on my key takeaways. Check out our latest analysis for Applied Materials
How Well Did AMAT Perform?
To account for any quarterly or half-yearly updates, I use the ‘latest twelve-month’ data, which either annualizes the most recent 6-month earnings update, or in some cases, the most recent annual report is already the latest available financial data. This blend enables me to assess different companies on a more comparable basis, using new information. Applied Materials’s most recent bottom-line is $3,434.0M, which, in comparison to last year’s level, has risen by a significant 99.89%. Given that these figures may be somewhat myopic, I’ve determined an annualized five-year value for Applied Materials’s earnings, which stands at $1,281.2M. This means that, generally, Applied Materials has been able to steadily improve its earnings over the last few years as well.
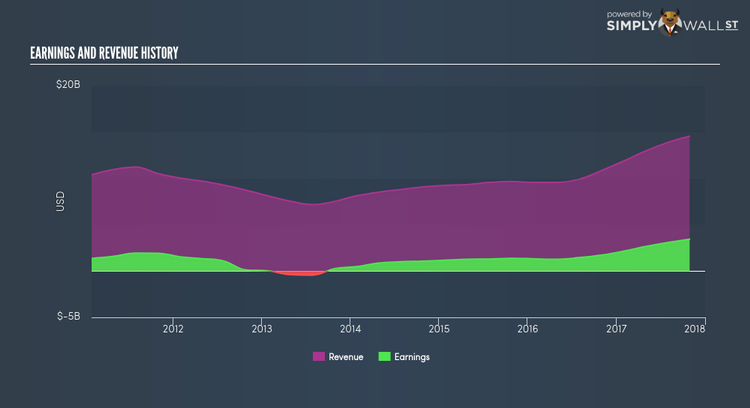
What’s the driver of this growth? Well, let’s take a look at if it is solely because of an industry uplift, or if Applied Materials has seen some company-specific growth. Over the last few years, Applied Materials increased its bottom line faster than revenue by successfully controlling its costs. This has caused a margin expansion and profitability over time. Eyeballing growth from a sector-level, the US semiconductors and semiconductor equipment industry has been relatively flat in terms of earnings growth in the prior twelve months, settling down from a solid 18.32% over the previous five years. This means that whatever near-term headwind the industry is facing, Applied Materials is relatively better-cushioned than its peers.
What does this mean?
Though Applied Materials’s past data is helpful, it is only one aspect of my investment thesis. Positive growth and profitability are what investors like to see in a company’s track record, but how do we properly assess sustainability? I recommend you continue to research Applied Materials to get a better picture of the stock by looking at:
1. Future Outlook: What are well-informed industry analysts predicting for AMAT’s future growth? Take a look at our free research report of analyst consensus for AMAT’s outlook.
2. Financial Health: Is AMAT’s operations financially sustainable? Balance sheets can be hard to analyze, which is why we’ve done it for you. Check out our financial health checks here.
3. Other High-Performing Stocks: Are there other stocks that provide better prospects with proven track records? Explore our free list of these great stocks here.
NB: Figures in this article are calculated using data from the last twelve months, which refer to the 12-month period ending on the last date of the month the financial statement is dated. This may not be consistent with full year annual report figures.
To help readers see pass the short term volatility of the financial market, we aim to bring you a long-term focused research analysis purely driven by fundamental data. Note that our analysis does not factor in the latest price sensitive company announcements.
The author is an independent contributor and at the time of publication had no position in the stocks mentioned.
