ams AG (VTX:AMS): Did It Outperform The Industry?

Examining ams AG’s (VTX:AMS) past track record of performance is a useful exercise for investors. It allows us to reflect on whether the company has met or exceed expectations, which is a powerful signal for future performance. Below, I will assess AMS’s latest performance announced on 30 June 2018 and weight these figures against its longer term trend and industry movements.
See our latest analysis for ams
How AMS fared against its long-term earnings performance and its industry
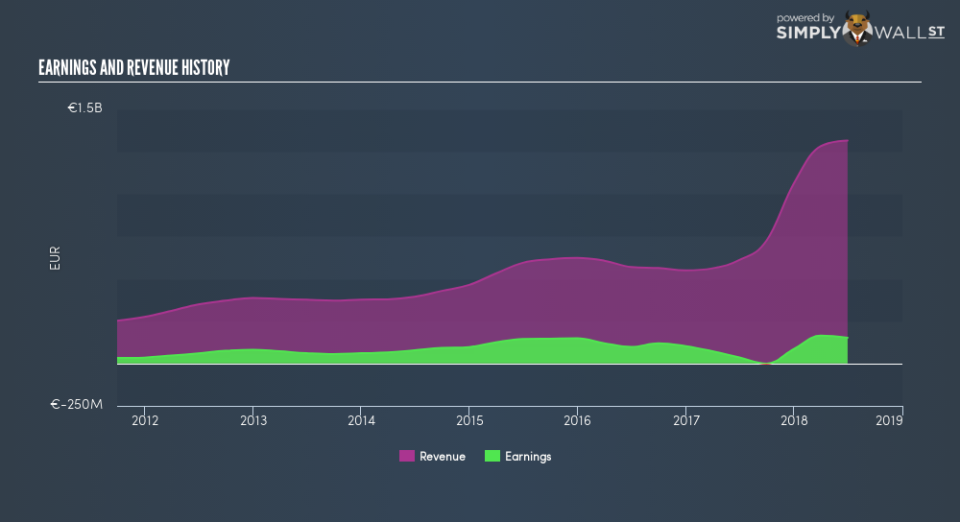
AMS’s trailing twelve-month earnings (from 30 June 2018) of €152.8m has more than doubled from €102.9m in the prior year.
Furthermore, this one-year growth rate has exceeded its 5-year annual growth average of 10.7%, indicating the rate at which AMS is growing has accelerated. What’s enabled this growth? Let’s see whether it is merely owing to an industry uplift, or if ams has seen some company-specific growth.
The rise in earnings seems to be bolstered by a substantial top-line increase overtaking its growth rate of expenses. Though this brought about a margin contraction, it has made ams more profitable.
Eyeballing growth from a sector-level, the CH semiconductor industry has been growing its average earnings by double-digit 19.8% in the previous year, and 13.9% over the past half a decade. Since the Semiconductor sector in CH is relatively small, I’ve included similar companies in the wider region in order to get a better idea of the growth, which is a median of profitable companies of companies such as u-blox Holding, and . This means any tailwind the industry is profiting from, ams is able to leverage this to its advantage.
In terms of returns from investment, ams has fallen short of achieving a 20% return on equity (ROE), recording 12.5% instead. Furthermore, its return on assets (ROA) of 3.7% is below the CH Semiconductor industry of 7.3%, indicating ams’s are utilized less efficiently. And finally, its return on capital (ROC), which also accounts for ams’s debt level, has declined over the past 3 years from 19.1% to 3.4%. This correlates with an increase in debt holding, with debt-to-equity ratio rising from 18.7% to 124% over the past 5 years.
What does this mean?
While past data is useful, it doesn’t tell the whole story. Companies that have performed well in the past, such as ams gives investors conviction. However, the next step would be to assess whether the future looks as optimistic. You should continue to research ams to get a better picture of the stock by looking at:
Future Outlook: What are well-informed industry analysts predicting for AMS’s future growth? Take a look at our free research report of analyst consensus for AMS’s outlook.
Financial Health: Are AMS’s operations financially sustainable? Balance sheets can be hard to analyze, which is why we’ve done it for you. Check out our financial health checks here.
Other High-Performing Stocks: Are there other stocks that provide better prospects with proven track records? Explore our free list of these great stocks here.
NB: Figures in this article are calculated using data from the trailing twelve months from 30 June 2018. This may not be consistent with full year annual report figures.
To help readers see past the short term volatility of the financial market, we aim to bring you a long-term focused research analysis purely driven by fundamental data. Note that our analysis does not factor in the latest price-sensitive company announcements.
The author is an independent contributor and at the time of publication had no position in the stocks mentioned. For errors that warrant correction please contact the editor at editorial-team@simplywallst.com.
