PREMIUM: How to identify breakout opportunities (Micron:MU)
This detailed reporting was brought to you by Gary Christie, Head of North American Research at Trading Central using Yahoo Finance Premium's Enhanced Charting feature. Click here to start your free trial* and step up your investing.
The S&P 500 is testing key resistance at 2950 inside a short-term trading range with key support at 2820. The 50- and 200-day moving averages are just outside these key levels. The question remains, do we break above or below the consolidation range?
Yahoo Finance Premium integrates Trading Central’s automated pattern recognition to plot technical events onto price charts. This enables you to easily identify bullish or bearish classic patterns for the short, mid, and long term. Let’s explore this feature using Micron as an example.
Micron (MU: NASDAQ) confirmed a classic bullish Symmetrical Continuation Triangle pattern. Prices have broken upward out of a consolidation period, suggesting a continuation of the prior uptrend.
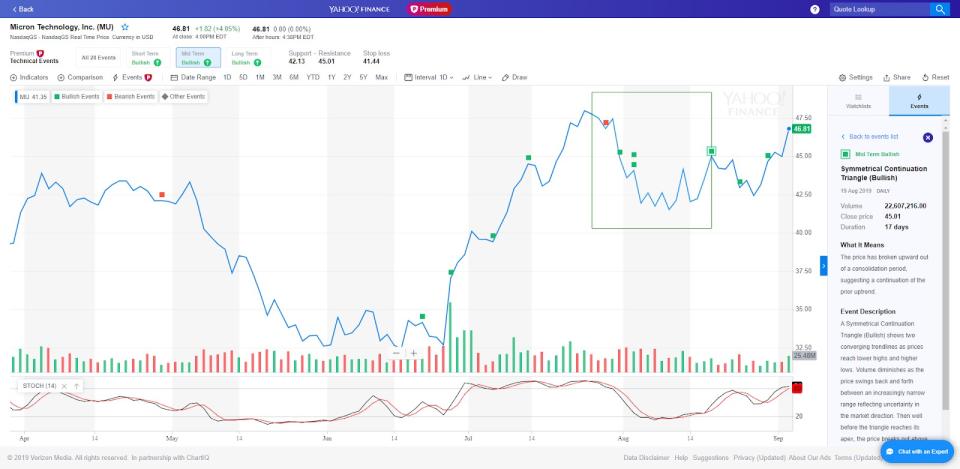
A bullish Symmetrical Continuation Triangle pattern shows two converging trendlines as prices reach lower highs and higher lows. Volume diminishes as the price swings back and forth between an increasingly narrow range reflecting uncertainty in the market direction. Then well before the triangle reaches its apex, the price breaks out above the upper trendline with a noticeable increase in volume, confirming the pattern as a continuation of the prior uptrend.
The symmetrical triangle pattern yields a measured move target into the $51.75 to $53.50 range with an ideal trailing stop at $41.44 according to Trading Central’s algorithm.

