The New York Fed just got even more bullish on the U.S. economy
Themes:
Tax bill set for passage this week
Individual mandate requirement set to lapse
CPI gains momentum in November, +0.4%
Atlanta Fed business inflation expectations edge higher, 2.1% Y/Y
First full week of data for jobless claims (225k) in December indicates further tightening of the job market
New York Fed raises Q4 GDP guidance
As expected, last week’s equity market trading was largely focused on the tax bill winding its way through reconciliation. With each barrier to passage eliminated through negotiation, equity markets gained traction. It was a solid week for equity investors. The S&P 500 (^GSPC) tacked on 0.8% while the Dow (^DJI) added 1.3% and the Nasdaq Composite (^IXIC) moved 1.1% higher. In all three cases, nearly all of the week’s index gains came on Friday. Expectations are for the U.S. tax code legislation to be voted on this Tuesday — just in time for year’s end.
A bit lost in the sauce last week was the expected move by the FOMC to raise rates by 25 bps. The move to tighten was so widely expected that neither equity markets nor credit markets reacted. In short, it was baked into prices before the announcement. In some respects that lack of market reaction was a policy win for Chair Janet Yellen in that she has taken great pains to eliminate the volatility and misdirection that has historically been the result of the Federal Reserve’s opaque process.

This week’s economic calendar focuses on, among other things, housing. Today, the Housing Market Index hit an 18-year high. In the following days, we also get housing starts data, mortgage application data, existing home and new home sales figures. It is also that time on the calendar when we get a good look at the Fed’s data for regional districts. We receive the Philadelphia Fed Business Outlook Survey, the Chicago National Activity Index and the Kansas City Fed Manufacturing Index.
Potentially the most interesting data of the week will come on Thursday when the third estimate of GDP for Q3 is released. Bloomberg consensus is calling for 3.3%, unchanged from the second reading, which rose .3% from the initial. What makes this reading so interesting is that the New York Fed last Friday raised its estimate of the Q4 US GDP closer to 4% based on the economic acceleration and revisions to data we have seen materialize recently.
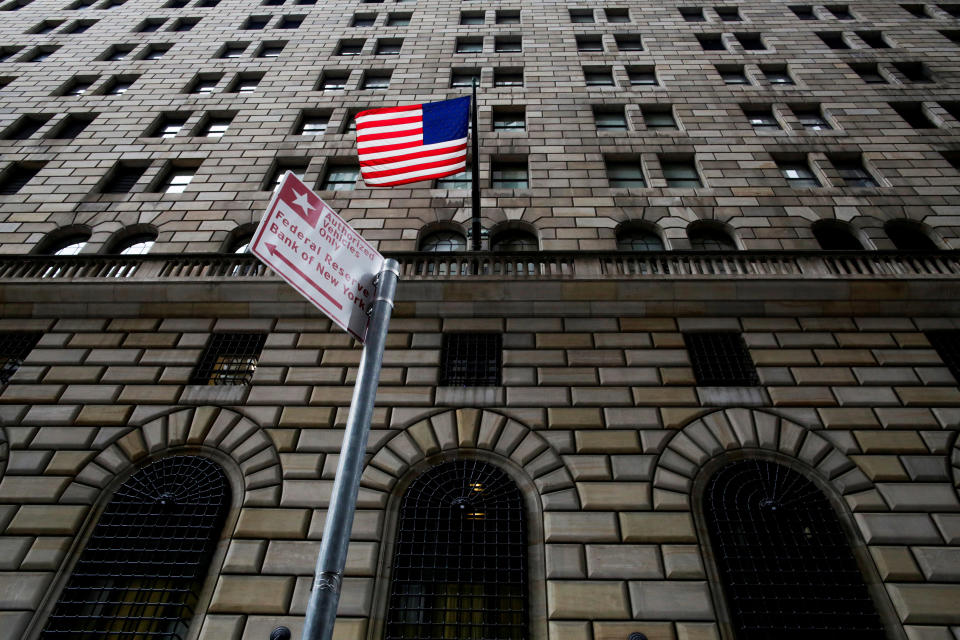
The “Nowcast” modeling that the New York Fed uses to gauge real-time activity seems to suggest that Q4 GDP will be substantially stronger than the figures posted for Q3. According to the New York Fed, the economy is expanding at an annualized rate of 3.98% in the fourth quarter. Given that data as a backdrop and tax reform’s potential to add additional momentum to business activity and economic growth in coming quarters it appears as though 2018 is setting up to be a solid year for equity investors.
That seemingly constructive landscape could of course be unsettled by any number of variables currently unaccounted for by investors. The list of variables must by necessity include the ongoing special counsel investigation being led by Robert Mueller. It seems as though there are new revelations about the investigative team daily. Additionally, it appears as though the focus of the investigative effort has morphed from collusion to obstruction to confusion. There really is no way of knowing what the ultimate outcome or charges will even look like, or for that matter, when the investigation will conclude.
Commentary by Sam Stovall, chief investment strategist at CFRA Research

Last week’s fifth 25-basis point rate hike in short-term interest rates by the FOMC since December 2015 moves the current tightening cycle into a tie for sixth place for the greatest number of rate actions in a single cycle. The highest count belongs to the cycle started in 2004, when the Fed raised Fed funds on 17 separate occasions. Second place belongs to the cycle started in 1977, when the Fed raised the discount rate 14 times. Should the FOMC continue tightening rates three more times through the end of 2018, as we project, this cycle will end up being the second-longest at 36 months, but well behind the 81-month discount-rate tightening cycle that lasted from 1946 through 1953 following the post-war boom that saw U.S. Real GDP grow at a more-than 5% compound annual growth rate. During the current economic expansion, which started in June 2009, real GDP has risen by less than half that rate at only 2.2%.
——————————————————-
WTI Crude Oil (Nymex) (CL=F) $57.10/bbl
Gold (Comex) (GC=F) $1,264.90/t. oz.
10-year Treasury Note yield (CBOE) (^TNX) 2.394%
Volatility S&P 500 (^VIX) 9.34
——————————————————-
Economic Calendar:
Tuesday
8:30 AM Housing Starts
8:30 AM Current Account
8:55 AM Redbook
Neel Kashkari, 1:10 PM
Wednesday
7:00 AM MBA Mortgage Applications
10:00 AM Existing Home Sales
10:30 AM EIA Petroleum Status report
Thursday
8:30 AM GDP
8:30 AM Weekly Jobless Claims
8:30 AM Philadelphia Fed Business Outlook Survey
8:30 AM Chicago Fed National Activity Index
8:30 AM Corporate Profits
9:00 AM FHFA House Price Index
9:45 AM Bloomberg Consumer Comfort Index
10:00 AM Leading Indicators
Friday
8:30 AM Durable Goods Orders
8:30 AM Personal Income and Outlays
10:00 AM New Home Sales
10:00 AM Consumer Sentiment
11:00 AM Kansas City Fed Manufacturing Index
1:00 PM Baker-Hughes rig Count
(All times are Eastern Standard.)

