Midterm Election Countdown: Historically October Best Time to Buy
One of the more interesting graphics that keeps coming across my screen(s) is a table of S&P 500 returns in the months leading up to Midterm election day. We have gone ahead and recreated the table using data sourced from the annual Stock Trader’s Almanac starting with the midterm election in 1950. This results in 17 years of data to analyze.
Click here to view table full size…
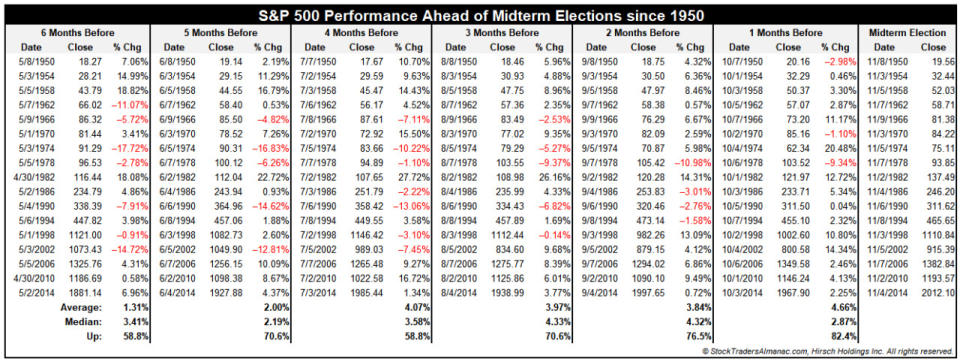
This table does not contain a worrisome amount of red and the percentage of time the periods are positive is also quite respectable. Keen observers will notice that the average historical return for the 6 months before midterm Election Day is just 1.31% compared to an average historical return of 4.66% for the 1-month immediately preceding midterm Election Day. In fact, the historical average performance in all periods before the 1-month period is less than 4.66%. So what is really happening in the 6-months prior to midterm Election Day?
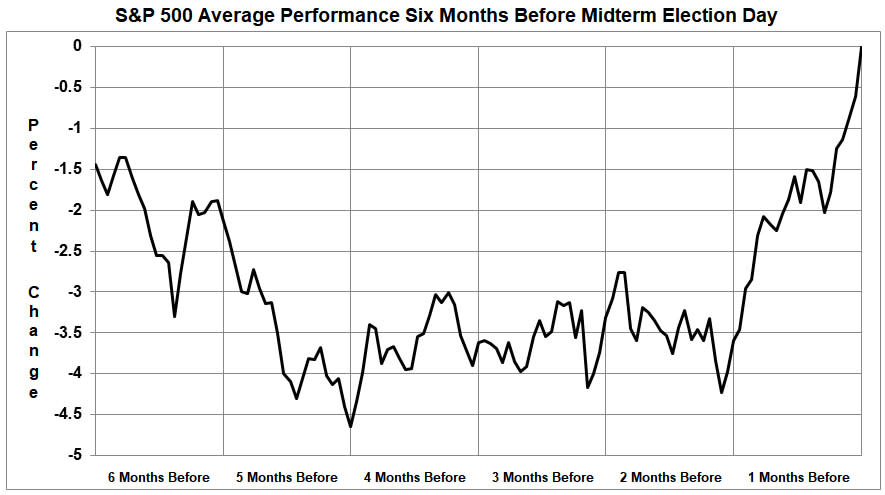
S&P 500 is actually declining in May/June and then trading sideways until late September/early October. On average the vast majority of S&P 500 gains are from late September to midterm Election Day. Thus far in 2018 there has not been any meaningful decline, but it is still early in August with nearly three months to go before midterm elections.
